MetLife 2011 Annual Report Download - page 126
Download and view the complete annual report
Please find page 126 of the 2011 MetLife annual report below. You can navigate through the pages in the report by either clicking on the pages listed below, or by using the keyword search tool below to find specific information within the annual report.-
 1
1 -
2
-
3
-
4
-
5
-
6
-
7
-
8
-
9
-
10
-
11
-
12
-
13
-
14
-
15
-
16
-
17
-
18
-
19
-
20
-
21
-
22
-
23
-
24
-
25
-
26
-
27
-
28
-
29
-
30
-
31
-
32
-
33
-
34
-
35
-
36
-
37
-
38
-
39
-
40
-
41
-
42
-
43
-
44
-
45
-
46
-
47
-
48
-
49
-
50
-
51
-
52
-
53
-
54
-
55
-
56
-
57
-
58
-
59
-
60
-
61
-
62
-
63
-
64
-
65
-
66
-
67
-
68
-
69
-
70
-
71
-
72
-
73
-
74
-
75
-
76
-
77
-
78
-
79
-
80
-
81
-
82
-
83
-
84
-
85
-
86
-
87
-
88
-
89
-
90
-
91
-
92
-
93
-
94
-
95
-
96
-
97
-
98
-
99
-
100
-
101
-
102
-
103
-
104
-
105
-
106
-
107
-
108
-
109
-
110
-
111
-
112
-
113
-
114
-
115
-
 116
116 -
 117
117 -
 118
118 -
 119
119 -
 120
120 -
 121
121 -
 122
122 -
 123
123 -
 124
124 -
 125
125 -
 126
126 -
 127
127 -
 128
128 -
 129
129 -
 130
130 -
 131
131 -
 132
132 -
 133
133 -
 134
134 -
 135
135 -
 136
136 -
137
-
138
-
139
-
140
-
141
-
142
-
143
-
144
-
145
-
146
-
147
-
148
-
149
-
150
-
151
-
152
-
153
-
154
-
155
-
156
-
157
-
158
-
159
-
160
-
161
-
162
-
163
-
164
-
165
-
166
-
167
-
168
-
169
-
170
-
171
-
172
-
173
-
174
-
175
-
176
-
177
-
178
-
179
-
180
-
181
-
182
-
183
-
184
-
185
-
186
-
187
-
188
-
189
-
190
-
191
-
192
-
193
-
194
-
195
-
196
-
197
-
198
-
199
-
200
-
201
-
202
-
203
-
204
-
205
-
206
-
207
-
208
-
209
-
210
-
211
-
212
-
213
-
214
-
215
-
216
-
217
-
218
-
219
-
220
-
221
-
222
-
223
-
224
-
225
-
226
-
227
-
228
-
229
-
230
-
231
-
232
-
233
-
234
-
235
-
236
-
237
-
238
-
239
-
240
-
241
-
242
-
243
 |
 |

MetLife, Inc.
Notes to the Consolidated Financial Statements — (Continued)
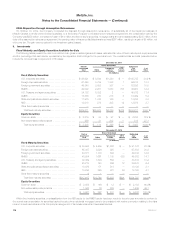
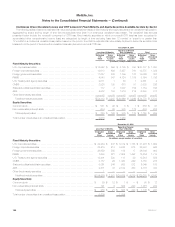
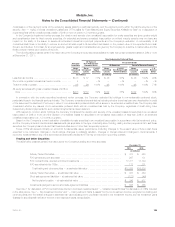
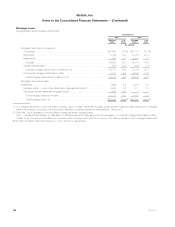
Continuous Gross Unrealized Losses and OTTI Losses for Fixed Maturity and Equity Securities Available-for-Sale by Sector
The following tables present the estimated fair value and gross unrealized losses of fixed maturity and equity securities in an unrealized loss position,
aggregated by sector and by length of time that the securities have been in a continuous unrealized loss position. The unrealized loss amounts
presented below include the noncredit component of OTTI loss. Fixed maturity securities on which a noncredit OTTI loss has been recognized in
accumulated other comprehensive income (loss) are categorized by length of time as being “less than 12 months” or “equal to or greater than
12 months” in a continuous unrealized loss position based on the point in time that the estimated fair value initially declined to below the amortized cost
basis and not the period of time since the unrealized loss was deemed a noncredit OTTI loss.
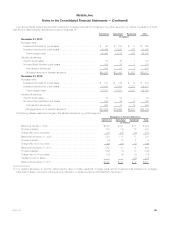
December 31, 2011
Less than 12 Months Equal to or Greater
than 12 Months Total
Estimated
Fair
Value
Gross
Unrealized
Losses
Estimated
Fair
Value
Gross
Unrealized
Losses
Estimated
Fair
Value
Gross
Unrealized
Losses
(In millions, except number of securities)
Fixed Maturity Securities:
U.S. corporate securities ............................................... $15,642 $ 590 $ 5,135 $ 790 $ 20,777 $ 1,380
Foreign corporate securities ............................................. 12,618 639 5,957 700 18,575 1,339
Foreign government securities ........................................... 11,227 230 1,799 127 13,026 357
RMBS .............................................................. 4,040 547 4,724 1,189 8,764 1,736
U.S. Treasury and agency securities ...................................... 2,611 1 50 1 2,661 2
CMBS .............................................................. 2,825 135 678 91 3,503 226
State and political subdivision securities .................................... 177 2 1,007 154 1,184 156
ABS ............................................................... 4,972 103 1,316 214 6,288 317
Other fixed maturity securities ............................................ — — — — — —
Total fixed maturity securities .......................................... $54,112 $ 2,247 $ 20,666 $ 3,266 $ 74,778 $ 5,513
Equity Securities:
Common stock ....................................................... $ 581 $ 96 $ 5 $ 1 $ 586 $ 97
Non-redeemable preferred stock ......................................... 204 30 370 172 574 202
Total equity securities ................................................ $ 785 $ 126 $ 375 $ 173 $ 1,160 $ 299
Total number of securities in an unrealized loss position ....................... 3,978 1,963
December 31, 2010
Less than 12 Months Equal to or Greater
than 12 Months Total
Estimated
Fair
Value
Gross
Unrealized
Losses
Estimated
Fair
Value
Gross
Unrealized
Losses
Estimated
Fair
Value
Gross
Unrealized
Losses
(In millions, except number of securities)
Fixed Maturity Securities:
U.S. corporate securities ............................................... $ 22,954 $ 447 $ 8,319 $ 1,155 $ 31,273 $ 1,602
Foreign corporate securities ............................................ 22,415 410 3,976 515 26,391 925
Foreign government securities ........................................... 26,659 585 189 17 26,848 602
RMBS ............................................................. 7,630 221 7,624 1,492 15,254 1,713
U.S. Treasury and agency securities ...................................... 13,401 530 118 29 13,519 559
CMBS ............................................................. 3,787 29 1,363 249 5,150 278
State and political subdivision securities ................................... 5,061 246 988 272 6,049 518
ABS............................................................... 2,671 33 2,102 350 4,773 383
Other fixed maturity securities ........................................... 1 — — — 1 —
Total fixed maturity securities .......................................... $104,579 $ 2,501 $ 24,679 $ 4,079 $ 129,258 $ 6,580
Equity Securities:
Common stock ...................................................... $ 89 $ 12 $ 1 $ — $ 90 $ 12
Non-redeemable preferred stock ........................................ 191 9 824 220 1,015 229
Total equity securities ............................................... $ 280 $ 21 $ 825 $ 220 $ 1,105 $ 241
Total number of securities in an unrealized loss position ....................... 5,609 1,704
122 MetLife, Inc.