MetLife 2011 Annual Report Download - page 106
Download and view the complete annual report
Please find page 106 of the 2011 MetLife annual report below. You can navigate through the pages in the report by either clicking on the pages listed below, or by using the keyword search tool below to find specific information within the annual report.-
 1
1 -
2
-
3
-
4
-
5
-
6
-
7
-
8
-
9
-
10
-
11
-
12
-
13
-
14
-
15
-
16
-
17
-
18
-
19
-
20
-
21
-
22
-
23
-
24
-
25
-
26
-
27
-
28
-
29
-
30
-
31
-
32
-
33
-
34
-
35
-
36
-
37
-
38
-
39
-
40
-
41
-
42
-
43
-
44
-
45
-
46
-
47
-
48
-
49
-
50
-
51
-
52
-
53
-
54
-
55
-
56
-
57
-
58
-
59
-
60
-
61
-
62
-
63
-
64
-
65
-
66
-
67
-
68
-
69
-
70
-
71
-
72
-
73
-
74
-
75
-
76
-
77
-
78
-
79
-
80
-
81
-
82
-
83
-
84
-
85
-
86
-
87
-
88
-
89
-
90
-
91
-
92
-
93
-
94
-
95
-
 96
96 -
 97
97 -
 98
98 -
 99
99 -
 100
100 -
 101
101 -
 102
102 -
 103
103 -
 104
104 -
 105
105 -
 106
106 -
 107
107 -
 108
108 -
 109
109 -
 110
110 -
 111
111 -
 112
112 -
 113
113 -
 114
114 -
 115
115 -
 116
116 -
117
-
118
-
119
-
120
-
121
-
122
-
123
-
124
-
125
-
126
-
127
-
128
-
129
-
130
-
131
-
132
-
133
-
134
-
135
-
136
-
137
-
138
-
139
-
140
-
141
-
142
-
143
-
144
-
145
-
146
-
147
-
148
-
149
-
150
-
151
-
152
-
153
-
154
-
155
-
156
-
157
-
158
-
159
-
160
-
161
-
162
-
163
-
164
-
165
-
166
-
167
-
168
-
169
-
170
-
171
-
172
-
173
-
174
-
175
-
176
-
177
-
178
-
179
-
180
-
181
-
182
-
183
-
184
-
185
-
186
-
187
-
188
-
189
-
190
-
191
-
192
-
193
-
194
-
195
-
196
-
197
-
198
-
199
-
200
-
201
-
202
-
203
-
204
-
205
-
206
-
207
-
208
-
209
-
210
-
211
-
212
-
213
-
214
-
215
-
216
-
217
-
218
-
219
-
220
-
221
-
222
-
223
-
224
-
225
-
226
-
227
-
228
-
229
-
230
-
231
-
232
-
233
-
234
-
235
-
236
-
237
-
238
-
239
-
240
-
241
-
242
-
243
 |
 |
MetLife, Inc.
Notes to the Consolidated Financial Statements — (Continued)
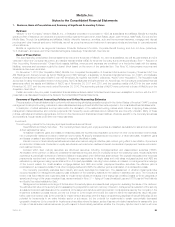
The Company considers three broad valuation techniques: (i) the market approach, (ii) the income approach, and (iii) the cost approach. The
Company determines the most appropriate valuation technique to use, given what is being measured and the availability of sufficient inputs, giving
priority to observable inputs. The Company categorizes its assets and liabilities measured at estimated fair value into a three-level hierarchy, based on
the significant input with the lowest level in its valuation. The input levels are as follows:
Level 1 Unadjusted quoted prices in active markets for identical assets or liabilities. The Company defines active markets based on average trading
volume for equity securities. The size of the bid/ask spread is used as an indicator of market activity for fixed maturity securities.
Level 2 Quoted prices in markets that are not active or inputs that are observable either directly or indirectly. These inputs can include quoted
prices for similar assets or liabilities other than quoted prices in Level 1, quoted prices in markets that are not active, or other significant
inputs that are observable or can be derived principally from or corroborated by observable market data for substantially the full term of the
assets or liabilities.
Level 3 Unobservable inputs that are supported by little or no market activity and are significant to the estimated fair value of the assets or liabilities.
Unobservable inputs reflect the reporting entity’s own assumptions about the assumptions that market participants would use in pricing the
asset or liability.
Cash and Cash Equivalents
The Company considers all highly liquid securities and other investments purchased with an original or remaining maturity of three months or less at
the date of purchase to be cash equivalents. Cash equivalents are stated at amortized cost, which approximates estimated fair value.
Property, Equipment, Leasehold Improvements and Computer Software
Property, equipment and leasehold improvements, which are included in other assets, are stated at cost, less accumulated depreciation and
amortization. Depreciation is determined using the straight-line method over the estimated useful lives of the assets, as appropriate. The estimated life
for company occupied real estate property is generally 40 years. Estimated lives generally range from five to 10 years for leasehold improvements and
three to seven years for all other property and equipment. The cost basis of the property, equipment and leasehold improvements was $2.5 billion and
$2.4 billion at December 31, 2011 and 2010, respectively. Accumulated depreciation and amortization of property, equipment and leasehold
improvements was $1.2 billion at both December 31, 2011 and 2010. Related depreciation and amortization expense was $199 million, $151 million
and $151 million for the years ended December 31, 2011, 2010 and 2009, respectively.
Computer software, which is included in other assets, is stated at cost, less accumulated amortization. Purchased software costs, as well as certain
internal and external costs incurred to develop internal-use computer software during the application development stage, are capitalized. Such costs are
amortized generally over a four-year period using the straight-line method. The cost basis of computer software was $2.2 billion and $2.0 billion at
December 31, 2011 and 2010, respectively. Accumulated amortization of capitalized software was $1.5 billion and $1.4 billion at December 31, 2011
and 2010, respectively. Related amortization expense was $217 million, $189 million and $171 million for the years ended December 31, 2011, 2010
and 2009, respectively.
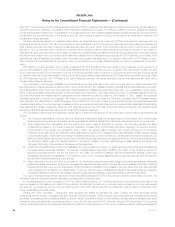
Deferred Policy Acquisition Costs and Value of Business Acquired
The Company incurs significant costs in connection with acquiring new and renewal insurance business. Costs that vary with and relate to the
production of new business are deferred as deferred policy acquisition costs (“DAC”). Such costs consist principally of commissions, certain agency
expenses, policy issuance expenses and certain advertising costs. Value of business acquired (“VOBA”) is an intangible asset resulting from a business
combination that represents the excess of book value over the estimated fair value of acquired insurance, annuity, and investment-type contracts
in-force at the acquisition date. The estimated fair value of the acquired liabilities is based on actuarially determined projections, by each block of
business, of future policy and contract charges, premiums, mortality and morbidity, separate account performance, surrenders, operating expenses,
investment returns, nonperformance risk adjustment and other factors. Actual experience on the purchased business may vary from these projections.
The recovery of DAC and VOBA is dependent upon the future profitability of the related business. DAC and VOBA are aggregated in the consolidated
financial statements for reporting purposes.
The Company amortizes DAC for credit life insurance, property and casualty insurance and other short-duration contracts, which is primarily
composed of commissions and certain underwriting expenses, in proportion to historic and future earned premium over the applicable contract term.
The Company amortizes DAC and VOBA on life insurance, accident and health and investment-type contracts in proportion to gross premiums,
gross margins or gross profits, depending on the type of contract as described below.
The Company amortizes DAC and VOBA related to non-participating and non-dividend-paying traditional contracts (term insurance, non-participating
whole life insurance, traditional group life insurance, non-medical health insurance, and accident and health insurance) over the appropriate premium
paying period in proportion to the present value of actual historic and expected future gross premiums. The present value of expected premiums is
based upon the premium requirement of each policy and assumptions for mortality, morbidity, persistency and investment returns at policy issuance, or
policy acquisition (as it relates to VOBA), that include provisions for adverse deviation that are consistent with the assumptions used to calculate future
policyholder benefit liabilities. These assumptions are not revised after policy issuance or acquisition unless the DAC or VOBA balance is deemed to be
unrecoverable from future expected profits. Absent a premium deficiency, variability in amortization after policy issuance or acquisition is caused only by
variability in premium volumes.
The Company amortizes DAC and VOBA related to participating, dividend-paying traditional contracts over the estimated lives of the contracts in
proportion to actual and expected future gross margins. The amortization includes interest based on rates in effect at inception or acquisition of the
contracts. The future gross margins are dependent principally on investment returns, policyholder dividend scales, mortality, persistency, expenses to
administer the business, creditworthiness of reinsurance counterparties and certain economic variables, such as inflation. For participating contracts
within the closed block (dividend paying traditional contracts) future gross margins are also dependent upon changes in the policyholder dividend
obligation. Of these factors, the Company anticipates that investment returns, expenses, persistency and other factor changes, as well as policyholder
dividend scales are reasonably likely to impact significantly the rate of DAC and VOBA amortization. Each reporting period, the Company updates the
estimated gross margins with the actual gross margins for that period. When the actual gross margins change from previously estimated gross margins,
the cumulative DAC and VOBA amortization is re-estimated and adjusted by a cumulative charge or credit to current operations. When actual gross
102 MetLife, Inc.