MetLife 2011 Annual Report Download - page 212
Download and view the complete annual report
Please find page 212 of the 2011 MetLife annual report below. You can navigate through the pages in the report by either clicking on the pages listed below, or by using the keyword search tool below to find specific information within the annual report.-
 1
1 -
2
-
3
-
4
-
5
-
6
-
7
-
8
-
9
-
10
-
11
-
12
-
13
-
14
-
15
-
16
-
17
-
18
-
19
-
20
-
21
-
22
-
23
-
24
-
25
-
26
-
27
-
28
-
29
-
30
-
31
-
32
-
33
-
34
-
35
-
36
-
37
-
38
-
39
-
40
-
41
-
42
-
43
-
44
-
45
-
46
-
47
-
48
-
49
-
50
-
51
-
52
-
53
-
54
-
55
-
56
-
57
-
58
-
59
-
60
-
61
-
62
-
63
-
64
-
65
-
66
-
67
-
68
-
69
-
70
-
71
-
72
-
73
-
74
-
75
-
76
-
77
-
78
-
79
-
80
-
81
-
82
-
83
-
84
-
85
-
86
-
87
-
88
-
89
-
90
-
91
-
92
-
93
-
94
-
95
-
96
-
97
-
98
-
99
-
100
-
101
-
102
-
103
-
104
-
105
-
106
-
107
-
108
-
109
-
110
-
111
-
112
-
113
-
114
-
115
-
116
-
117
-
118
-
119
-
120
-
121
-
122
-
123
-
124
-
125
-
126
-
127
-
128
-
129
-
130
-
131
-
132
-
133
-
134
-
135
-
136
-
137
-
138
-
139
-
140
-
141
-
142
-
143
-
144
-
145
-
146
-
147
-
148
-
149
-
150
-
151
-
152
-
153
-
154
-
155
-
156
-
157
-
158
-
159
-
160
-
161
-
162
-
163
-
164
-
165
-
166
-
167
-
168
-
169
-
170
-
171
-
172
-
173
-
174
-
175
-
176
-
177
-
178
-
179
-
180
-
181
-
182
-
183
-
184
-
185
-
186
-
187
-
188
-
189
-
190
-
191
-
192
-
193
-
194
-
195
-
196
-
197
-
198
-
199
-
200
-
201
-
 202
202 -
 203
203 -
 204
204 -
 205
205 -
 206
206 -
 207
207 -
 208
208 -
 209
209 -
 210
210 -
 211
211 -
 212
212 -
 213
213 -
 214
214 -
 215
215 -
 216
216 -
 217
217 -
 218
218 -
 219
219 -
 220
220 -
 221
221 -
 222
222 -
223
-
224
-
225
-
226
-
227
-
228
-
229
-
230
-
231
-
232
-
233
-
234
-
235
-
236
-
237
-
238
-
239
-
240
-
241
-
242
-
243
 |
 |

MetLife, Inc.
Notes to the Consolidated Financial Statements — (Continued)
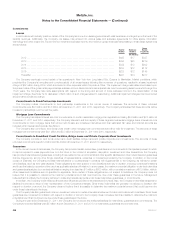
The weighted average expected rate of return on plan assets for use in that plan’s valuation in 2012 is currently anticipated to be 7.00% for U.S.
pension benefits and 6.22% for U.S. other postretirement benefits. The weighted average expected rate of return on plan assets for use in that plan’s
valuation in 2012 is currently anticipated to be 2.05% for non-U.S. pension benefits and 6.54% for non-U.S. other postretirement benefits.
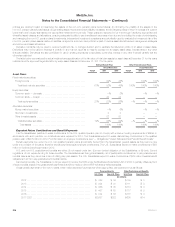
The assumed healthcare costs trend rates used in measuring the APBO and net periodic benefit costs were as follows:
December 31,
2011 2010
Pre-and Post-Medicare eligible claims . . . 7.3% in 2012, gradually decreasing
each year until 2083 reaching the
ultimate rate of 4.3%.
7.8% in 2011, gradually decreasing each
year until 2083 reaching the ultimate rate
of 4.4%.
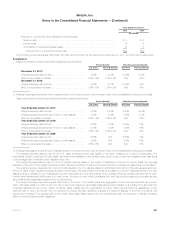
Assumed healthcare costs trend rates may have a significant effect on the amounts reported for healthcare plans. A 1% change in assumed
healthcare costs trend rates would have the following effects: U.S. Plans Non-U.S. Plans
One Percent
Increase One Percent
Decrease One Percent
Increase One Percent
Decrease
(In millions)
Effect on total of service and interest costs components ................................ $ 7 $ (9) $— $—
Effect of accumulated postretirement benefit obligations ................................ $195 $(160) $ 1 $ (1)
Plan Assets
The pension and other postretirement benefit plan assets are categorized into the three-level fair value hierarchy, as defined in Note 1, based upon
the priority of the inputs to the respective valuation technique. The following summarizes the types of assets included within the three-level fair value
hierarchy presented below.
Level 1 This category includes investments in fixed maturity securities, equity securities, derivative securities, and short-term investments which
have unadjusted quoted market prices in active markets for identical assets and liabilities.
Level 2 This category includes certain separate accounts that are primarily invested in liquid and readily marketable securities. The estimated fair
value of such separate account is based upon reported NAV provided by fund managers and this value represents the amount at which
transfers into and out of the respective separate account are effected. These separate accounts provide reasonable levels of price
transparency and can be corroborated through observable market data.
Certain separate accounts are invested in investment partnerships designated as hedge funds. The values for these separate accounts is
determined monthly based on the NAV of the underlying hedge fund investment. Additionally, such hedge funds generally contain lock out
or other waiting period provisions for redemption requests to be filled. While the reporting and redemption restrictions may limit the
frequency of trading activity in separate accounts invested in hedge funds, the reported NAV, and thus the referenced value of the
separate account, provides a reasonable level of price transparency that can be corroborated through observable market data.
Directly held investments are primarily invested in U.S. and foreign government and corporate securities.
Level 3 This category includes separate accounts that are invested in fixed maturity securities, equity securities, pass-through securities, derivative
securities, and other invested assets that provide little or no price transparency due to the infrequency with which the underlying assets
trade and generally require additional time to liquidate in an orderly manner. Accordingly, the values for separate accounts invested in these
alternative asset classes are based on inputs that cannot be readily derived from or corroborated by observable market data.
U.S. Plans
Most U.S. Subsidiaries have issued group annuity and life insurance contracts supporting the pension and other postretirement benefit plans assets,
which are invested primarily in separate accounts.
The underlying assets of the separate accounts are principally comprised of cash and cash equivalents, short-term investments, fixed maturity and
equity securities, mutual funds, real estate, private equity investments and hedge funds investments.
208 MetLife, Inc.