MetLife 2011 Annual Report Download - page 34
Download and view the complete annual report
Please find page 34 of the 2011 MetLife annual report below. You can navigate through the pages in the report by either clicking on the pages listed below, or by using the keyword search tool below to find specific information within the annual report.-
 1
1 -
2
-
3
-
4
-
5
-
6
-
7
-
8
-
9
-
10
-
11
-
12
-
13
-
14
-
15
-
16
-
17
-
18
-
19
-
20
-
21
-
22
-
23
-
 24
24 -
 25
25 -
 26
26 -
 27
27 -
 28
28 -
 29
29 -
 30
30 -
 31
31 -
 32
32 -
 33
33 -
 34
34 -
 35
35 -
 36
36 -
 37
37 -
 38
38 -
 39
39 -
 40
40 -
 41
41 -
 42
42 -
 43
43 -
 44
44 -
45
-
46
-
47
-
48
-
49
-
50
-
51
-
52
-
53
-
54
-
55
-
56
-
57
-
58
-
59
-
60
-
61
-
62
-
63
-
64
-
65
-
66
-
67
-
68
-
69
-
70
-
71
-
72
-
73
-
74
-
75
-
76
-
77
-
78
-
79
-
80
-
81
-
82
-
83
-
84
-
85
-
86
-
87
-
88
-
89
-
90
-
91
-
92
-
93
-
94
-
95
-
96
-
97
-
98
-
99
-
100
-
101
-
102
-
103
-
104
-
105
-
106
-
107
-
108
-
109
-
110
-
111
-
112
-
113
-
114
-
115
-
116
-
117
-
118
-
119
-
120
-
121
-
122
-
123
-
124
-
125
-
126
-
127
-
128
-
129
-
130
-
131
-
132
-
133
-
134
-
135
-
136
-
137
-
138
-
139
-
140
-
141
-
142
-
143
-
144
-
145
-
146
-
147
-
148
-
149
-
150
-
151
-
152
-
153
-
154
-
155
-
156
-
157
-
158
-
159
-
160
-
161
-
162
-
163
-
164
-
165
-
166
-
167
-
168
-
169
-
170
-
171
-
172
-
173
-
174
-
175
-
176
-
177
-
178
-
179
-
180
-
181
-
182
-
183
-
184
-
185
-
186
-
187
-
188
-
189
-
190
-
191
-
192
-
193
-
194
-
195
-
196
-
197
-
198
-
199
-
200
-
201
-
202
-
203
-
204
-
205
-
206
-
207
-
208
-
209
-
210
-
211
-
212
-
213
-
214
-
215
-
216
-
217
-
218
-
219
-
220
-
221
-
222
-
223
-
224
-
225
-
226
-
227
-
228
-
229
-
230
-
231
-
232
-
233
-
234
-
235
-
236
-
237
-
238
-
239
-
240
-
241
-
242
-
243
 |
 |

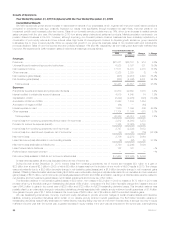
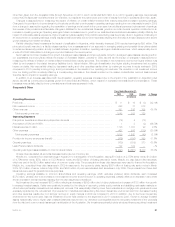
Year Ended December 31, 2009
Insurance
Products Retirement
Products
Corporate
Benefit
Funding Auto &
Home Japan
Other
International
Regions Corporate
& Other Total
(In millions)
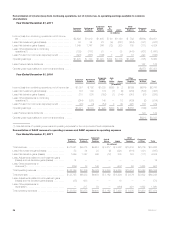
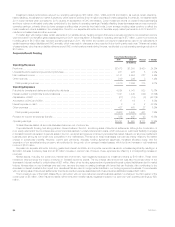
Income (loss) from continuing operations, net of income tax . . $ (422) $ (466) $ (746) $321 $— $(289) $(734) $(2,336)
Less: Net investment gains (losses) ..................... (472) (533) (1,486) (41) — (100) (269) (2,901)
Less: Net derivative gains (losses) ...................... (1,786) (1,175) (672) 39 — (798) (474) (4,866)
Less: Other adjustments to continuing operations(1) ........ (146) 379 121 — — (206) 332 480
Less: Provision for income tax (expense) benefit ........... 840 465 711 1 — 364 216 2,597
Operating earnings .................................. $1,142 $ 398 $ 580 $322 $— $ 451 (539) 2,354
Less: Preferred stock dividends ........................ 122 122
Operating earnings available to common shareholders ...... $(661) $ 2,232
(1) See definitions of operating revenues and operating expenses for the components of such adjustments.
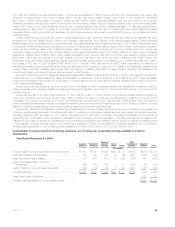
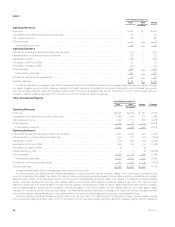
Reconciliation of GAAP revenues to operating revenues and GAAP expenses to operating expenses
Year Ended December 31, 2010
Insurance
Products Retirement
Products
Corporate
Benefit
Funding Auto &
Home Japan
Other
International
Regions Corporate
& Other Total
(In millions)
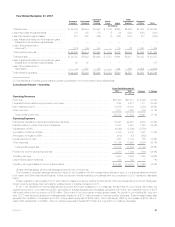
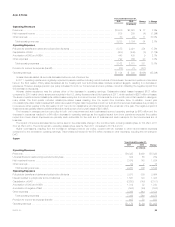
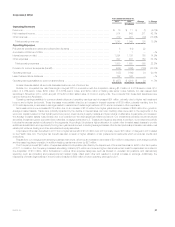
Total revenues ................................... $26,444 $6,849 $7,568 $3,146 $ 669 $5,685 $1,904 $52,265
Less: Net investment gains (losses) .................. 103 139 176 (7) (9) (280) (530) (408)
Less: Net derivative gains (losses) ................... 215 235 (162) (1) (144) (347) (61) (265)
Less: Adjustments related to net investment gains (losses)
and net derivative gains (losses) ................... 1 — — — — — — 1
Less: Other adjustments to revenues(1) ............... (151) (39) 190 — 116 (72) 1,450 1,494
Total operating revenues ........................... $26,276 $6,514 $7,364 $3,154 $ 706 $6,384 $1,045 $51,443
Total expenses .................................. $24,338 $5,622 $5,999 $2,781 $ 664 $5,917 $3,032 $48,353
Less: Adjustments related to net investment gains (losses)
and net derivative gains (losses) ................... 90 35 — — — — — 125
Less: Other adjustments to expenses(1) ............... 4 307 50 — 104 367 1,452 2,284
Total operating expenses .......................... $24,244 $5,280 $5,949 $2,781 $ 560 $5,550 $1,580 $45,944
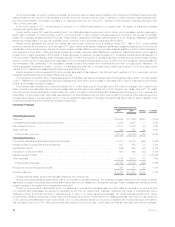
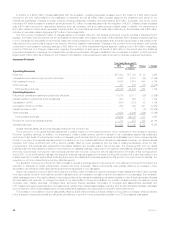
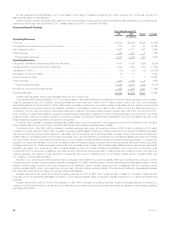
Year Ended December 31, 2009
Insurance
Products Retirement
Products
Corporate
Benefit
Funding Auto &
Home Japan
Other
International
Regions Corporate
& Other Total
(In millions)
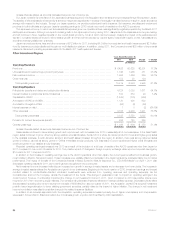
Total revenues ................................... $23,476 $ 3,975 $ 5,231 $3,113 $ — $3,997 $ 865 $40,657
Less: Net investment gains (losses) ................... (472) (533) (1,486) (41) — (100) (269) (2,901)
Less: Net derivative gains (losses) .................... (1,786) (1,175) (672) 39 — (798) (474) (4,866)
Less: Adjustments related to net investment gains (losses)
and net derivative gains (losses) .................... (27) — — — — — — (27)
Less: Other adjustments to revenues(1) ................ (81) (51) 184 — — (169) 1,283 1,166
Total operating revenues ........................... $25,842 $ 5,734 $ 7,205 $3,115 $ — $5,064 $ 325 $47,285
Total expenses ................................... $24,165 $ 4,690 $ 6,400 $2,697 $ — $4,495 $2,571 $45,018
Less: Adjustments related to net investment gains (losses)
and net derivative gains (losses) .................... 39 (739) — — — — — (700)
Less: Other adjustments to expenses(1) ............... (1) 309 63 — — 37 951 1,359
Total operating expenses ........................... $24,127 $ 5,120 $ 6,337 $2,697 $ — $4,458 $1,620 $44,359
(1) See definitions of operating revenues and operating expenses for the components of such adjustments.
30 MetLife, Inc.