MetLife 2011 Annual Report Download - page 130
Download and view the complete annual report
Please find page 130 of the 2011 MetLife annual report below. You can navigate through the pages in the report by either clicking on the pages listed below, or by using the keyword search tool below to find specific information within the annual report.-
 1
1 -
2
-
3
-
4
-
5
-
6
-
7
-
8
-
9
-
10
-
11
-
12
-
13
-
14
-
15
-
16
-
17
-
18
-
19
-
20
-
21
-
22
-
23
-
24
-
25
-
26
-
27
-
28
-
29
-
30
-
31
-
32
-
33
-
34
-
35
-
36
-
37
-
38
-
39
-
40
-
41
-
42
-
43
-
44
-
45
-
46
-
47
-
48
-
49
-
50
-
51
-
52
-
53
-
54
-
55
-
56
-
57
-
58
-
59
-
60
-
61
-
62
-
63
-
64
-
65
-
66
-
67
-
68
-
69
-
70
-
71
-
72
-
73
-
74
-
75
-
76
-
77
-
78
-
79
-
80
-
81
-
82
-
83
-
84
-
85
-
86
-
87
-
88
-
89
-
90
-
91
-
92
-
93
-
94
-
95
-
96
-
97
-
98
-
99
-
100
-
101
-
102
-
103
-
104
-
105
-
106
-
107
-
108
-
109
-
110
-
111
-
112
-
113
-
114
-
115
-
116
-
117
-
118
-
119
-
 120
120 -
 121
121 -
 122
122 -
 123
123 -
 124
124 -
 125
125 -
 126
126 -
 127
127 -
 128
128 -
 129
129 -
 130
130 -
 131
131 -
 132
132 -
 133
133 -
 134
134 -
 135
135 -
 136
136 -
 137
137 -
 138
138 -
 139
139 -
 140
140 -
141
-
142
-
143
-
144
-
145
-
146
-
147
-
148
-
149
-
150
-
151
-
152
-
153
-
154
-
155
-
156
-
157
-
158
-
159
-
160
-
161
-
162
-
163
-
164
-
165
-
166
-
167
-
168
-
169
-
170
-
171
-
172
-
173
-
174
-
175
-
176
-
177
-
178
-
179
-
180
-
181
-
182
-
183
-
184
-
185
-
186
-
187
-
188
-
189
-
190
-
191
-
192
-
193
-
194
-
195
-
196
-
197
-
198
-
199
-
200
-
201
-
202
-
203
-
204
-
205
-
206
-
207
-
208
-
209
-
210
-
211
-
212
-
213
-
214
-
215
-
216
-
217
-
218
-
219
-
220
-
221
-
222
-
223
-
224
-
225
-
226
-
227
-
228
-
229
-
230
-
231
-
232
-
233
-
234
-
235
-
236
-
237
-
238
-
239
-
240
-
241
-
242
-
243
 |
 |

MetLife, Inc.
Notes to the Consolidated Financial Statements — (Continued)
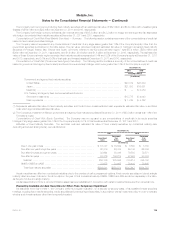
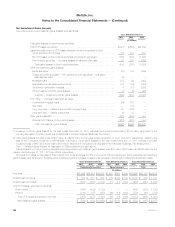
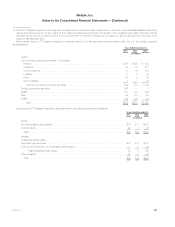
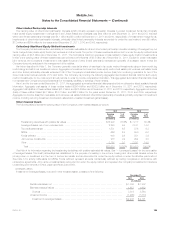
Net Investment Gains (Losses)
The components of net investment gains (losses) were as follows:
Years Ended December 31,
2011 2010 2009
(In millions)
Total gains (losses) on fixed maturity securities:
Total OTTI losses recognized .............................................. $(924) $(682) $(2,432)
Less: Noncredit portion of OTTI losses transferred to and recognized in other
comprehensive income (loss) ............................................ (31) 212 939
Net OTTI losses on fixed maturity securities recognized in earnings(1) ............. (955) (470) (1,493)
Fixed maturity securities — net gains (losses) on sales and disposals ............. 25 215 (165)
Total gains (losses) on fixed maturity securities ............................. (930) (255) (1,658)
Other net investment gains (losses):
Equity securities ....................................................... (23) 104 (399)
Trading and other securities — FVO general account securities — changes in
estimated fair value .................................................. (2) — —
Mortgage loans ....................................................... 175 22 (442)
Real estate and real estate joint ventures ................................... 134 (54) (164)
Other limited partnership interests ......................................... 4 (18) (356)
Other investment portfolio gains (losses) .................................... (7) (6) (26)
Subtotal — investment portfolio gains (losses) ............................. (649) (207) (3,045)
FVO CSEs — changes in estimated fair value:
Commercial mortgage loans ............................................. (84) 758 —
Securities ............................................................ — (78) —
Long-term debt — related to commercial mortgage loans ...................... 97 (722) —
Long-term debt — related to securities ..................................... (8) 48 —
Other gains (losses)(2) .................................................... (223) (207) 144
Subtotal FVO CSEs and other gains (losses) ................................. (218) (201) 144
Total net investment gains (losses) ...................................... $(867) $(408) $(2,901)
(1) Investment portfolio gains (losses) for the year ended December 31, 2011 includes intent-to-sell impairments of ($154) million as a result of the
pending disposition of certain operations of MetLife Bank and the Caribbean Business. See Note 2.
(2) Other gains (losses) includes a loss of $87 million and $209 million for the years ended December 31, 2011 and 2010, respectively, related to the
sale of the Company’s investment in MSI MetLife. See Note 2. Other gains (losses) for the year ended December 31, 2011 includes a goodwill
impairment loss of $65 million and a loss of $19 million related to the Company’s pending sale of the Caribbean Business. See Notes 2 and 7.
See “— Variable Interest Entities” for discussion of CSEs included in the table above.
Gains (losses) from foreign currency transactions included within net investment gains (losses) were $37 million, $230 million and $226 million for the
years ended December 31, 2011, 2010 and 2009, respectively.
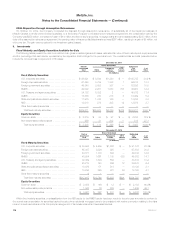
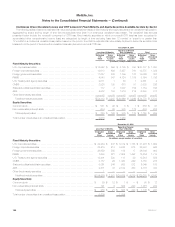
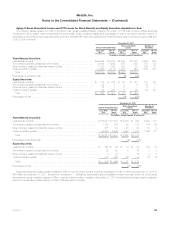
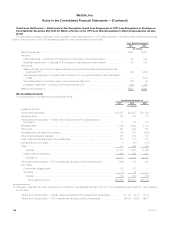
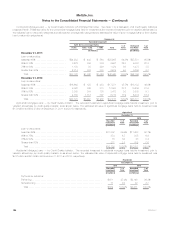
Proceeds from sales or disposals of fixed maturity and equity securities and the components of fixed maturity and equity securities net investment
gains (losses) were as shown in the table below. Investment gains and losses on sales of securities are determined on a specific identification basis.
Years Ended December 31, Years Ended December 31, Years Ended December 31,
2011 2010 2009 2011 2010 2009 2011 2010 2009
Fixed Maturity Securities Equity Securities Total
(In millions)
Proceeds ............................................ $67,449 $54,514 $38,972 $1,241 $616 $ 940 $68,690 $55,130 $39,912
Gross investment gains ................................. $ 892 $ 831 $ 939 $ 108 $129 $ 134 $ 1,000 $ 960 $ 1,073
Gross investment losses ................................ (867) (616) (1,104) (71) (11) (133) (938) (627) (1,237)
Total OTTI losses recognized in earnings:
Credit-related ....................................... (645) (423) (1,130) — — — (645) (423) (1,130)
Other(1) ........................................... (310) (47) (363) (60) (14) (400) (370) (61) (763)
Total OTTI losses recognized in earnings ................ (955) (470) (1,493) (60) (14) (400) (1,015) (484) (1,893)
Net investment gains (losses) ......................... $ (930) $ (255) $ (1,658) $ (23) $104 $(399) $ (953) $ (151) $ (2,057)
126 MetLife, Inc.