MetLife 2011 Annual Report Download - page 127
Download and view the complete annual report
Please find page 127 of the 2011 MetLife annual report below. You can navigate through the pages in the report by either clicking on the pages listed below, or by using the keyword search tool below to find specific information within the annual report.-
 1
1 -
2
-
3
-
4
-
5
-
6
-
7
-
8
-
9
-
10
-
11
-
12
-
13
-
14
-
15
-
16
-
17
-
18
-
19
-
20
-
21
-
22
-
23
-
24
-
25
-
26
-
27
-
28
-
29
-
30
-
31
-
32
-
33
-
34
-
35
-
36
-
37
-
38
-
39
-
40
-
41
-
42
-
43
-
44
-
45
-
46
-
47
-
48
-
49
-
50
-
51
-
52
-
53
-
54
-
55
-
56
-
57
-
58
-
59
-
60
-
61
-
62
-
63
-
64
-
65
-
66
-
67
-
68
-
69
-
70
-
71
-
72
-
73
-
74
-
75
-
76
-
77
-
78
-
79
-
80
-
81
-
82
-
83
-
84
-
85
-
86
-
87
-
88
-
89
-
90
-
91
-
92
-
93
-
94
-
95
-
96
-
97
-
98
-
99
-
100
-
101
-
102
-
103
-
104
-
105
-
106
-
107
-
108
-
109
-
110
-
111
-
112
-
113
-
114
-
115
-
116
-
 117
117 -
 118
118 -
 119
119 -
 120
120 -
 121
121 -
 122
122 -
 123
123 -
 124
124 -
 125
125 -
 126
126 -
 127
127 -
 128
128 -
 129
129 -
 130
130 -
 131
131 -
 132
132 -
 133
133 -
 134
134 -
 135
135 -
 136
136 -
 137
137 -
138
-
139
-
140
-
141
-
142
-
143
-
144
-
145
-
146
-
147
-
148
-
149
-
150
-
151
-
152
-
153
-
154
-
155
-
156
-
157
-
158
-
159
-
160
-
161
-
162
-
163
-
164
-
165
-
166
-
167
-
168
-
169
-
170
-
171
-
172
-
173
-
174
-
175
-
176
-
177
-
178
-
179
-
180
-
181
-
182
-
183
-
184
-
185
-
186
-
187
-
188
-
189
-
190
-
191
-
192
-
193
-
194
-
195
-
196
-
197
-
198
-
199
-
200
-
201
-
202
-
203
-
204
-
205
-
206
-
207
-
208
-
209
-
210
-
211
-
212
-
213
-
214
-
215
-
216
-
217
-
218
-
219
-
220
-
221
-
222
-
223
-
224
-
225
-
226
-
227
-
228
-
229
-
230
-
231
-
232
-
233
-
234
-
235
-
236
-
237
-
238
-
239
-
240
-
241
-
242
-
243
 |
 |

MetLife, Inc.
Notes to the Consolidated Financial Statements — (Continued)
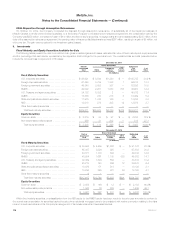
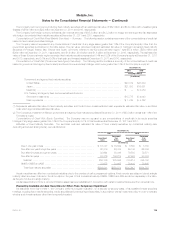
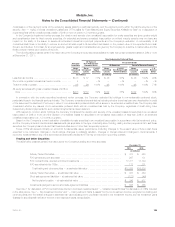
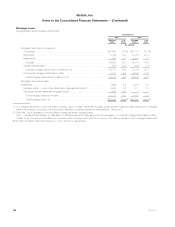
Aging of Gross Unrealized Losses and OTTI Losses for Fixed Maturity and Equity Securities Available-for-Sale
The following tables present the cost or amortized cost, gross unrealized losses, including the portion of OTTI loss on fixed maturity securities
recognized in accumulated other comprehensive income (loss), gross unrealized losses as a percentage of cost or amortized cost and number of
securities for fixed maturity and equity securities where the estimated fair value had declined and remained below cost or amortized cost by less than
20%, or 20% or more at:
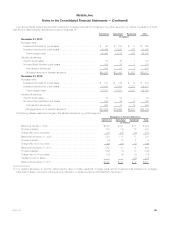
December 31, 2011
Cost or Amortized Cost Gross Unrealized
Losses Number of
Securities
Less than
20% 20% or
more Less than
20% 20% or
more Less than
20% 20% or
more
(In millions, except number of securities)
Fixed Maturity Securities:
Less than six months ................................................. $49,249 $ 4,736 $1,346 $ 1,332 3,260 320
Six months or greater but less than nine months ............................ 4,104 1,049 279 349 375 63
Nine months or greater but less than twelve months ......................... 1,160 288 55 93 143 14
Twelve months or greater .............................................. 17,590 2,115 1,216 843 1,523 167
Total ............................................................ $72,103 $ 8,188 $2,896 $ 2,617
Percentage of amortized cost ........................................... 4% 32%
Equity Securities:
Less than six months ................................................. $ 714 $ 376 $ 64 $ 123 154 42
Six months or greater but less than nine months ............................ 22 8 2 4 19 3
Nine months or greater but less than twelve months ......................... 18 — 2 — 8 —
Twelve months or greater .............................................. 98 223 8 96 24 20
Total ............................................................ $ 852 $ 607 $ 76 $ 223
Percentage of cost ................................................... 9% 37%
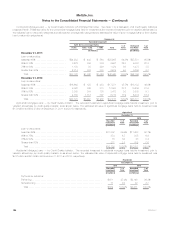
December 31, 2010
Cost or Amortized Cost Gross Unrealized
Losses Number of
Securities
Less than
20% 20% or
more Less than
20% 20% or
more Less than
20% 20% or
more
(In millions, except number of securities)
Fixed Maturity Securities:
Less than six months .................................................... $105,301 $ 1,403 $ 2,348 $ 368 5,320 121
Six months or greater but less than nine months ............................... 1,125 376 29 102 104 29
Nine months or greater but less than twelve months ............................ 371 89 28 27 50 9
Twelve months or greater ................................................ 21,627 5,546 1,863 1,815 1,245 311
Total ............................................................... $128,424 $ 7,414 $ 4,268 $ 2,312
Percentage of amortized cost ............................................. 3% 31%
Equity Securities:
Less than six months .................................................... $ 247 $ 94 $ 10 $ 22 106 33
Six months or greater but less than nine months ............................... 29 65 5 16 3 2
Nine months or greater but less than twelve months ............................ 6 47 — 16 3 2
Twelve months or greater ................................................ 518 340 56 116 35 14
Total ............................................................... $ 800 $ 546 $ 71 $ 170
Percentage of cost ..................................................... 9% 31%
Equity securities with gross unrealized losses of 20% or more for twelve months or greater decreased from $116 million at December 31, 2010 to
$96 million at December 31, 2011. As shown in the section “— Evaluating Temporarily Impaired Available-for-Sale Securities” below, all of the equity
securities with gross unrealized losses of 20% or more for twelve months or greater at December 31, 2011 were financial services industry investment
grade non-redeemable preferred stock, of which 71% were rated A or better.
MetLife, Inc. 123