MetLife 2011 Annual Report Download - page 129
Download and view the complete annual report
Please find page 129 of the 2011 MetLife annual report below. You can navigate through the pages in the report by either clicking on the pages listed below, or by using the keyword search tool below to find specific information within the annual report.-
 1
1 -
2
-
3
-
4
-
5
-
6
-
7
-
8
-
9
-
10
-
11
-
12
-
13
-
14
-
15
-
16
-
17
-
18
-
19
-
20
-
21
-
22
-
23
-
24
-
25
-
26
-
27
-
28
-
29
-
30
-
31
-
32
-
33
-
34
-
35
-
36
-
37
-
38
-
39
-
40
-
41
-
42
-
43
-
44
-
45
-
46
-
47
-
48
-
49
-
50
-
51
-
52
-
53
-
54
-
55
-
56
-
57
-
58
-
59
-
60
-
61
-
62
-
63
-
64
-
65
-
66
-
67
-
68
-
69
-
70
-
71
-
72
-
73
-
74
-
75
-
76
-
77
-
78
-
79
-
80
-
81
-
82
-
83
-
84
-
85
-
86
-
87
-
88
-
89
-
90
-
91
-
92
-
93
-
94
-
95
-
96
-
97
-
98
-
99
-
100
-
101
-
102
-
103
-
104
-
105
-
106
-
107
-
108
-
109
-
110
-
111
-
112
-
113
-
114
-
115
-
116
-
117
-
118
-
 119
119 -
 120
120 -
 121
121 -
 122
122 -
 123
123 -
 124
124 -
 125
125 -
 126
126 -
 127
127 -
 128
128 -
 129
129 -
 130
130 -
 131
131 -
 132
132 -
 133
133 -
 134
134 -
 135
135 -
 136
136 -
 137
137 -
 138
138 -
 139
139 -
140
-
141
-
142
-
143
-
144
-
145
-
146
-
147
-
148
-
149
-
150
-
151
-
152
-
153
-
154
-
155
-
156
-
157
-
158
-
159
-
160
-
161
-
162
-
163
-
164
-
165
-
166
-
167
-
168
-
169
-
170
-
171
-
172
-
173
-
174
-
175
-
176
-
177
-
178
-
179
-
180
-
181
-
182
-
183
-
184
-
185
-
186
-
187
-
188
-
189
-
190
-
191
-
192
-
193
-
194
-
195
-
196
-
197
-
198
-
199
-
200
-
201
-
202
-
203
-
204
-
205
-
206
-
207
-
208
-
209
-
210
-
211
-
212
-
213
-
214
-
215
-
216
-
217
-
218
-
219
-
220
-
221
-
222
-
223
-
224
-
225
-
226
-
227
-
228
-
229
-
230
-
231
-
232
-
233
-
234
-
235
-
236
-
237
-
238
-
239
-
240
-
241
-
242
-
243
 |
 |

MetLife, Inc.
Notes to the Consolidated Financial Statements — (Continued)
consideration of the payment terms of the underlying assets backing a particular security, and the payment priority within the tranche structure of the
security. See “— Aging of Gross Unrealized Losses and OTTI Losses for Fixed Maturity and Equity Securities Available-for-Sale” for a discussion of
equity securities with an unrealized loss position of 20% or more of cost for 12 months or greater.
In the Company’s impairment review process, the duration and severity of an unrealized loss position for equity securities are given greater weight
and consideration than for fixed maturity securities. An extended and severe unrealized loss position on a fixed maturity security may not have any
impact on the ability of the issuer to service all scheduled interest and principal payments and the Company’s evaluation of recoverability of all
contractual cash flows or the ability to recover an amount at least equal to its amortized cost based on the present value of the expected future cash
flows to be collected. In contrast, for an equity security, greater weight and consideration are given by the Company to a decline in market value and the
likelihood such market value decline will recover.
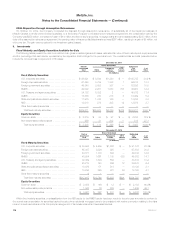
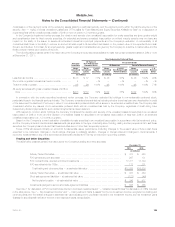
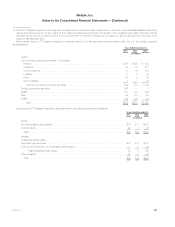
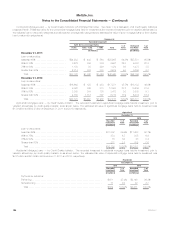
The following table presents certain information about the Company’s equity securities available-for-sale with gross unrealized losses of 20% or more
at December 31, 2011:
Non-Redeemable Preferred Stock
All Equity
Securities
All Types of
Non-Redeemable
Preferred Stock
Investment Grade
All Industries Financial Services Industry
Gross
Unrealized
Losses
Gross
Unrealized
Losses
% of All
Equity
Securities
Gross
Unrealized
Losses
% of All
Non-Redeemable
Preferred Stock
Gross
Unrealized
Losses % of All
Industries
%A
Rated or
Better
(In millions) (In millions) (In millions)
Less than six months ............................... $123 $ 87 71% $ 46 53% $ 46 100% 22%
Six months or greater but less than twelve months ........ 4 — —% — —% — —% —%
Twelve months or greater ............................ 96 96 100% 96 100% 96 100% 71%
All equity securities with gross unrealized losses of 20% or
more .......................................... $223 $183 82% $142 78% $142 100% 55%
In connection with the equity securities impairment review process, the Company evaluated its holdings in non-redeemable preferred stock,
particularly those in the financial services industry. The Company considered several factors including whether there has been any deterioration in credit
of the issuer and the likelihood of recovery in value of non-redeemable preferred stock with a severe or an extended unrealized loss. The Company also
considered whether any issuers of non-redeemable preferred stock with an unrealized loss held by the Company, regardless of credit rating, have
deferred any dividend payments. No such dividend payments had been deferred.
With respect to common stock holdings, the Company considered the duration and severity of the unrealized losses for securities in an unrealized
loss position of 20% or more; and the duration of unrealized losses for securities in an unrealized loss position of less than 20% in an extended
unrealized loss position (i.e., 12 months or greater).
Based on the Company’s current evaluation of available-for-sale securities in an unrealized loss position in accordance with its impairment policy,
and the Company’s current intentions and assessments (as applicable to the type of security) about holding, selling and any requirements to sell these
securities, the Company has concluded that these securities are not other-than-temporarily impaired.
Future OTTIs will depend primarily on economic fundamentals, issuer performance (including changes in the present value of future cash flows
expected to be collected), changes in credit ratings, changes in collateral valuation, changes in interest rates and changes in credit spreads. If
economic fundamentals or any of the above factors deteriorate, additional OTTIs may be incurred in upcoming quarters.
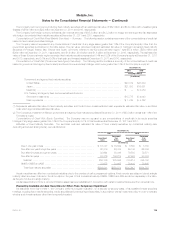
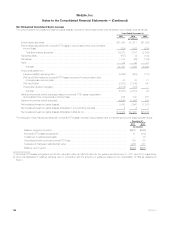
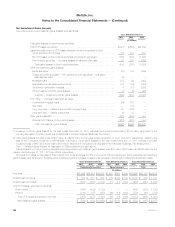
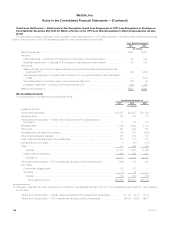
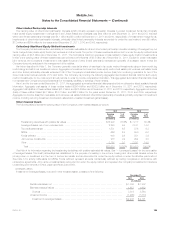
Trading and Other Securities
The table below presents certain information about the Company’s trading and other securities.
December 31,
2011 2010
(In millions)
Actively Traded Securities ....................................................... $ 473 $ 463
FVO general account securities .................................................. 267 131
FVO contractholder-directed unit-linked investments .................................. 17,411 17,794
FVO securities held by CSEs .................................................... 117 201
Total trading and other securities — at estimated fair value ........................... $18,268 $18,589
Actively Traded Securities — at estimated fair value .................................. $ 473 $ 463
Short sale agreement liabilities — at estimated fair value ............................... (127) (46)
Net long/short position — at estimated fair value ................................... $ 346 $ 417
Investments pledged to secure short sale agreement liabilities .......................... $ 558 $ 465
See Note 1 for discussion of FVO contractholder-directed unit-linked investments and “— Variable Interest Entities” for discussion of CSEs included
in the table above. See “— Net Investment Income” and “— Net Investment Gains (Losses)” for the net investment income recognized on trading and
other securities and the related changes in estimated fair value subsequent to purchase included in net investment income and net investment gains
(losses) for securities still held as of the end of the respective years, as applicable.
MetLife, Inc. 125