MetLife 2011 Annual Report Download - page 44
Download and view the complete annual report
Please find page 44 of the 2011 MetLife annual report below. You can navigate through the pages in the report by either clicking on the pages listed below, or by using the keyword search tool below to find specific information within the annual report.-
 1
1 -
2
-
3
-
4
-
5
-
6
-
7
-
8
-
9
-
10
-
11
-
12
-
13
-
14
-
15
-
16
-
17
-
18
-
19
-
20
-
21
-
22
-
23
-
24
-
25
-
26
-
27
-
28
-
29
-
30
-
31
-
32
-
33
-
 34
34 -
 35
35 -
 36
36 -
 37
37 -
 38
38 -
 39
39 -
 40
40 -
 41
41 -
 42
42 -
 43
43 -
 44
44 -
 45
45 -
 46
46 -
 47
47 -
 48
48 -
 49
49 -
 50
50 -
 51
51 -
 52
52 -
 53
53 -
 54
54 -
55
-
56
-
57
-
58
-
59
-
60
-
61
-
62
-
63
-
64
-
65
-
66
-
67
-
68
-
69
-
70
-
71
-
72
-
73
-
74
-
75
-
76
-
77
-
78
-
79
-
80
-
81
-
82
-
83
-
84
-
85
-
86
-
87
-
88
-
89
-
90
-
91
-
92
-
93
-
94
-
95
-
96
-
97
-
98
-
99
-
100
-
101
-
102
-
103
-
104
-
105
-
106
-
107
-
108
-
109
-
110
-
111
-
112
-
113
-
114
-
115
-
116
-
117
-
118
-
119
-
120
-
121
-
122
-
123
-
124
-
125
-
126
-
127
-
128
-
129
-
130
-
131
-
132
-
133
-
134
-
135
-
136
-
137
-
138
-
139
-
140
-
141
-
142
-
143
-
144
-
145
-
146
-
147
-
148
-
149
-
150
-
151
-
152
-
153
-
154
-
155
-
156
-
157
-
158
-
159
-
160
-
161
-
162
-
163
-
164
-
165
-
166
-
167
-
168
-
169
-
170
-
171
-
172
-
173
-
174
-
175
-
176
-
177
-
178
-
179
-
180
-
181
-
182
-
183
-
184
-
185
-
186
-
187
-
188
-
189
-
190
-
191
-
192
-
193
-
194
-
195
-
196
-
197
-
198
-
199
-
200
-
201
-
202
-
203
-
204
-
205
-
206
-
207
-
208
-
209
-
210
-
211
-
212
-
213
-
214
-
215
-
216
-
217
-
218
-
219
-
220
-
221
-
222
-
223
-
224
-
225
-
226
-
227
-
228
-
229
-
230
-
231
-
232
-
233
-
234
-
235
-
236
-
237
-
238
-
239
-
240
-
241
-
242
-
243
 |
 |

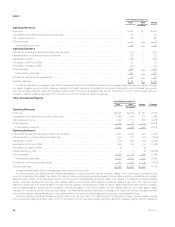
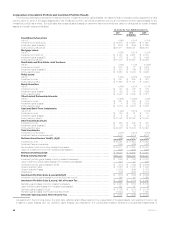
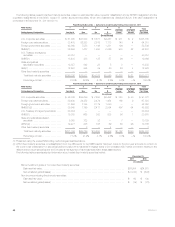
Select European Countries – Investment Exposures. Due to the current level of economic, fiscal and political strain in Europe’s perimeter region
and Cyprus, the Company continually monitors and adjusts its level of investment exposure in these countries. We manage direct and indirect
investment exposure in these countries through fundamental credit analysis. The following table presents a summary of investments by invested asset
class and related purchased credit default protection across Europe’s perimeter region, by country, and Cyprus.
Summary of Select European Country Investment Exposure at December 31, 2011(1)(2)
Fixed Maturity Securities(3)
Sovereign Financial
Services Non-Financial
Services Total
All Other
General Account
Investment
Exposure(4)(5) Total
Exposure(6) %
Purchased
Credit Default
Protection(7) Net
Exposure %
(In millions)
Europe’s perimeter region: .....
Portugal ................. $ 16 $ 4 $ 164 $ 184 $ 9 $ 193 5% $(31) $ 162 4%
Italy ..................... 30 242 995 1,267 80 1,347 33 (11) 1,336 33
Ireland ................... 16 6 537 559 532 1,091 26 — 1,091 27
Greece .................. 189 — — 189 203 392 9 — 392 9
Spain ................... 13 163 764 940 60 1,000 24 — 1,000 24
Total Europe’s perimeter
region ................... 264 415 2,460 3,139 884 4,023 97 (42) 3,981 97
Cyprus .................. 80 — — 80 34 114 3 — 114 3
Total ...................... $344 $415 $2,460 $3,219 $918 $4,137 100% $(42) $4,095 100%
As percent of total cash and
invested assets ............ 0.1% 0.1% 0.4% 0.6% 0.2% 0.8% 0.0% 0.8%
Investment grade percent ...... 41% 99% 93% 88%
Non investment grade
percent .................. 59% 1% 7% 12%
(1) Information is presented on a country of risk basis (e.g. the country where the issuer primarily conducts business).
(2) The Company has not written any credit default swaps with an underlying risk related to any of these six countries.
(3) Presented at estimated fair value. The par value and amortized cost of the fixed maturity securities were $3.9 billion and $3.4 billion, respectively, at
December 31, 2011.
(4) Comprised of equity securities, FVO general account securities, real estate and real estate joint ventures, other limited partnership interests, cash,
cash equivalents and short-term investments, and other invested assets at carrying value. See Note 1 of the Notes to the Consolidated Financial
Statements for an explanation of the carrying value for these invested asset classes.
(5) Excludes FVO contractholder-directed unit-linked investments of $667 million, which support unit-linked variable annuity type liabilities and do not
qualify for separate account summary total assets and liabilities. The contractholder, and not the Company, directs the investment of these funds.
The related variable annuity type liability is satisfied from the contractholder’s account balance and not from the general account investments of the
Company.
(6) There were no unfunded commitments related to these investments as of December 31, 2011.
(7) Purchased credit default protection is stated at the estimated fair value of the swap. For Portugal, the purchased credit default protection relates to
sovereign securities and this swap had a notional amount of $100 million and an estimated fair value of $31 million as of December 31, 2011. For
Italy, the purchased credit default protection relates to financial services corporate securities and these swaps had a notional amount of $80 million
and an estimated fair value of $11 million at December 31, 2011. The counterparties to these swaps are financial institutions with S&P credit ratings
ranging from A+ to A- as of December 31, 2011.
European Region Investments. The Company has investments across certain European Union member states and other countries in the region
that are not members of the European Union (collectively, the “European Region”). In the European Region, we have proactively mitigated risk in both
direct and indirect exposures by investing in a diversified portfolio of high quality investments with a focus on the higher-rated countries, reducing our
holdings through sales of financial services securities during 2010 and 2011 and sales of Europe’s perimeter region sovereign debt in 2011, and by
purchasing certain single name credit default protection in 2010 and 2011. Our sales of financial services securities were focused on institutions with
exposure to Europe’s perimeter region, lower preference capital structure instruments, and larger positions. Sovereign debt issued by countries outside
of Europe’s perimeter region comprised $8.4 billion, or 97% of European Region sovereign fixed maturity securities, at estimated fair value at
December 31, 2011. The European Region corporate securities (fixed maturity and perpetual hybrid securities classified as non-redeemable preferred
stock) are invested in a diversified portfolio of primarily non-financial services securities, which comprised $25.8 billion, or 77% of European Region total
corporate securities, at estimated fair value at December 31, 2011. Of these European Region sovereign fixed maturity and corporate securities, 92%
were investment grade and, for the 8% that were below investment grade, the majority were non-financial services corporate securities at December 31,
2011. European Region financial services corporate securities at estimated fair value were $7.6 billion, including $5.9 billion within the banking sector,
with 94% invested in investment grade rated corporate securities, at December 31, 2011.
Rating Actions — U.S. Treasury Securities. In August 2011, S&P downgraded the AAA rating on U.S. Treasury securities to AA+ with a negative
outlook, while Moody’s affirmed the Aaa rating on U.S. Treasury securities, but with a negative outlook. Fitch affirmed its AAA rating on U.S. Treasury
securities and kept its outlook stable. In October 2011, Moody’s affirmed its August 2011 ratings but revised its negative outlook to stable. In November
2011, Fitch affirmed its AAA rating on U.S. Treasury securities but changed its U.S. credit rating outlook to negative from stable, citing the failure of a
special Congressional committee to agree on certain deficit-reduction measures. We continue to closely evaluate the implications on our investment
portfolio of further rating agency downgrades of U.S. Treasury securities and believe our investment portfolio is well positioned. In light of the related
market uncertainty, we increased our liquidity position in July 2011. With the raising of the statutory debt ceiling in August 2011, we have subsequently
40 MetLife, Inc.