MetLife 2011 Annual Report Download - page 22
Download and view the complete annual report
Please find page 22 of the 2011 MetLife annual report below. You can navigate through the pages in the report by either clicking on the pages listed below, or by using the keyword search tool below to find specific information within the annual report.-
 1
1 -
2
-
3
-
4
-
5
-
6
-
7
-
8
-
9
-
10
-
11
-
 12
12 -
 13
13 -
 14
14 -
 15
15 -
 16
16 -
 17
17 -
 18
18 -
 19
19 -
 20
20 -
 21
21 -
 22
22 -
 23
23 -
 24
24 -
 25
25 -
 26
26 -
 27
27 -
 28
28 -
 29
29 -
 30
30 -
 31
31 -
 32
32 -
33
-
34
-
35
-
36
-
37
-
38
-
39
-
40
-
41
-
42
-
43
-
44
-
45
-
46
-
47
-
48
-
49
-
50
-
51
-
52
-
53
-
54
-
55
-
56
-
57
-
58
-
59
-
60
-
61
-
62
-
63
-
64
-
65
-
66
-
67
-
68
-
69
-
70
-
71
-
72
-
73
-
74
-
75
-
76
-
77
-
78
-
79
-
80
-
81
-
82
-
83
-
84
-
85
-
86
-
87
-
88
-
89
-
90
-
91
-
92
-
93
-
94
-
95
-
96
-
97
-
98
-
99
-
100
-
101
-
102
-
103
-
104
-
105
-
106
-
107
-
108
-
109
-
110
-
111
-
112
-
113
-
114
-
115
-
116
-
117
-
118
-
119
-
120
-
121
-
122
-
123
-
124
-
125
-
126
-
127
-
128
-
129
-
130
-
131
-
132
-
133
-
134
-
135
-
136
-
137
-
138
-
139
-
140
-
141
-
142
-
143
-
144
-
145
-
146
-
147
-
148
-
149
-
150
-
151
-
152
-
153
-
154
-
155
-
156
-
157
-
158
-
159
-
160
-
161
-
162
-
163
-
164
-
165
-
166
-
167
-
168
-
169
-
170
-
171
-
172
-
173
-
174
-
175
-
176
-
177
-
178
-
179
-
180
-
181
-
182
-
183
-
184
-
185
-
186
-
187
-
188
-
189
-
190
-
191
-
192
-
193
-
194
-
195
-
196
-
197
-
198
-
199
-
200
-
201
-
202
-
203
-
204
-
205
-
206
-
207
-
208
-
209
-
210
-
211
-
212
-
213
-
214
-
215
-
216
-
217
-
218
-
219
-
220
-
221
-
222
-
223
-
224
-
225
-
226
-
227
-
228
-
229
-
230
-
231
-
232
-
233
-
234
-
235
-
236
-
237
-
238
-
239
-
240
-
241
-
242
-
243
 |
 |

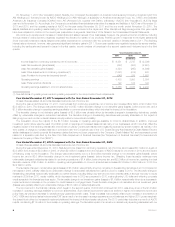
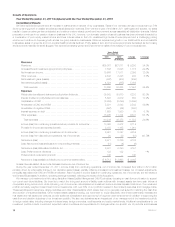
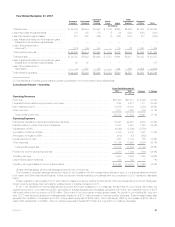
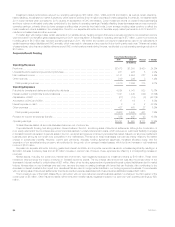
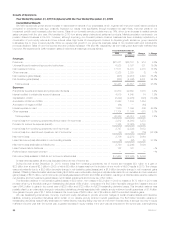
Results of Operations
Year Ended December 31, 2011 Compared with the Year Ended December 31, 2010
Consolidated Results
We have experienced growth and an increase in market share in several of our businesses. Sales of our domestic annuity products were up 51%
driven by strong growth in variable annuities across all distribution channels. Even with the impact of the March 2011 earthquake and tsunami, our sales
results in Japan are stronger than anticipated and continue to show steady growth and improvement across essentially all distribution channels. Market
penetration continues in our pension closeout business in the U.K.; however, our domestic pension closeout business has been adversely impacted by
a combination of poor equity market returns and lower interest rates. In the U.S., sustained high levels of unemployment and a challenging pricing
environment continue to depress growth across our group insurance businesses. While we experienced growth in our traditional life and universal life
businesses, sales of group life and non-medical health products declined. Policy sales of auto and homeowners products decreased as the housing
and automobile markets remained sluggish. We experienced steady growth and improvement in sales of the majority of our products abroad.
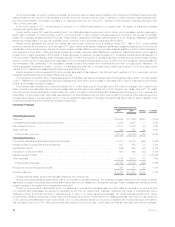
Years Ended
December 31,
Change % Change2011 2010
(In millions)
Revenues
Premiums ........................................................ $36,361 $27,071 $ 9,290 34.3%
Universal life and investment-type product policy fees ...................... 7,806 6,028 1,778 29.5%
Net investment income .............................................. 19,606 17,511 2,095 12.0%
Other revenues .................................................... 2,532 2,328 204 8.8%
Net investment gains (losses) ......................................... (867) (408) (459)
Net derivative gains (losses) .......................................... 4,824 (265) 5,089
Total revenues .................................................. 70,262 52,265 17,997 34.4%
Expenses
Policyholder benefits and claims and policyholder dividends ................. 36,903 30,670 6,233 20.3%
Interest credited to policyholder account balances ........................ 5,603 4,919 684 13.9%
Capitalization of DAC ............................................... (6,858) (3,299) (3,559)
Amortization of DAC and VOBA ....................................... 5,391 2,843 2,548 89.6%
Amortization of negative VOBA ........................................ (697) (64) (633)
Interest expense on debt ............................................ 1,629 1,550 79 5.1%
Other expenses ................................................... 18,265 11,734 6,531 55.7%
Total expenses .................................................. 60,236 48,353 11,883 24.6%
Income (loss) from continuing operations before provision for income tax ....... 10,026 3,912 6,114
Provision for income tax expense (benefit) ............................... 3,075 1,165 1,910
Income (loss) from continuing operations, net of income tax ................. 6,951 2,747 4,204
Income (loss) from discontinued operations, net of income tax ............... 20 39 (19) (48.7)%
Net income (loss) .................................................. 6,971 2,786 4,185
Less: Net income (loss) attributable to noncontrolling interests ............... (10) (4) (6)
Net income (loss) attributable to MetLife, Inc. ............................. 6,981 2,790 4,191
Less: Preferred stock dividends ....................................... 122 122 — —%
Preferred stock redemption premium ................................... 146 — 146
Net income (loss) available to MetLife, Inc.’s common shareholders ........... $ 6,713 $ 2,668 $ 4,045
Unless otherwise stated, all amounts discussed below are net of income tax.
During the year ended December 31, 2011, income (loss) from continuing operations, net of income tax, increased $4.2 billion to $7.0 billion
primarily driven by a favorable change in net derivative gains (losses), partially offset by increased net investment losses, net of related adjustments,
principally associated with DAC and VOBA amortization. Also included in income (loss) from continuing operations, net of income tax, are the results of
the Divested Businesses. In addition, operating earnings increased, reflecting the impact of the Acquisition.
We manage our investment portfolio using disciplined Asset/Liability Management (“ALM”) principles, focusing on cash flow and duration to support
our current and future liabilities. Our intent is to match the timing and amount of liability cash outflows with invested assets that have cash inflows of
comparable timing and amount, while optimizing, net of income tax, risk-adjusted net investment income and risk-adjusted total return. Our investment
portfolio is heavily weighted toward fixed income investments, with over 80% of our portfolio invested in fixed maturity securities and mortgage loans.
These securities and loans have varying maturities and other characteristics which cause them to be generally well suited for matching the cash flow
and duration of insurance liabilities. Other invested asset classes including, but not limited to, equity securities, other limited partnership interests and
real estate and real estate joint ventures, provide additional diversification and opportunity for long-term yield enhancement in addition to supporting the
cash flow and duration objectives of our investment portfolio. We also use derivatives as an integral part of our management of the investment portfolio
to hedge certain risks, including changes in interest rates, foreign currencies, credit spreads and equity market levels. Additional considerations for our
investment portfolio include current and expected market conditions and expectations for changes within our specific mix of products and business
18 MetLife, Inc.