MetLife 2011 Annual Report Download - page 46
Download and view the complete annual report
Please find page 46 of the 2011 MetLife annual report below. You can navigate through the pages in the report by either clicking on the pages listed below, or by using the keyword search tool below to find specific information within the annual report.-
 1
1 -
2
-
3
-
4
-
5
-
6
-
7
-
8
-
9
-
10
-
11
-
12
-
13
-
14
-
15
-
16
-
17
-
18
-
19
-
20
-
21
-
22
-
23
-
24
-
25
-
26
-
27
-
28
-
29
-
30
-
31
-
32
-
33
-
34
-
35
-
 36
36 -
 37
37 -
 38
38 -
 39
39 -
 40
40 -
 41
41 -
 42
42 -
 43
43 -
 44
44 -
 45
45 -
 46
46 -
 47
47 -
 48
48 -
 49
49 -
 50
50 -
 51
51 -
 52
52 -
 53
53 -
 54
54 -
 55
55 -
 56
56 -
57
-
58
-
59
-
60
-
61
-
62
-
63
-
64
-
65
-
66
-
67
-
68
-
69
-
70
-
71
-
72
-
73
-
74
-
75
-
76
-
77
-
78
-
79
-
80
-
81
-
82
-
83
-
84
-
85
-
86
-
87
-
88
-
89
-
90
-
91
-
92
-
93
-
94
-
95
-
96
-
97
-
98
-
99
-
100
-
101
-
102
-
103
-
104
-
105
-
106
-
107
-
108
-
109
-
110
-
111
-
112
-
113
-
114
-
115
-
116
-
117
-
118
-
119
-
120
-
121
-
122
-
123
-
124
-
125
-
126
-
127
-
128
-
129
-
130
-
131
-
132
-
133
-
134
-
135
-
136
-
137
-
138
-
139
-
140
-
141
-
142
-
143
-
144
-
145
-
146
-
147
-
148
-
149
-
150
-
151
-
152
-
153
-
154
-
155
-
156
-
157
-
158
-
159
-
160
-
161
-
162
-
163
-
164
-
165
-
166
-
167
-
168
-
169
-
170
-
171
-
172
-
173
-
174
-
175
-
176
-
177
-
178
-
179
-
180
-
181
-
182
-
183
-
184
-
185
-
186
-
187
-
188
-
189
-
190
-
191
-
192
-
193
-
194
-
195
-
196
-
197
-
198
-
199
-
200
-
201
-
202
-
203
-
204
-
205
-
206
-
207
-
208
-
209
-
210
-
211
-
212
-
213
-
214
-
215
-
216
-
217
-
218
-
219
-
220
-
221
-
222
-
223
-
224
-
225
-
226
-
227
-
228
-
229
-
230
-
231
-
232
-
233
-
234
-
235
-
236
-
237
-
238
-
239
-
240
-
241
-
242
-
243
 |
 |

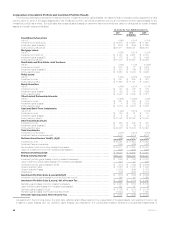
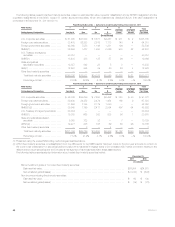
Composition of Investment Portfolio and Investment Portfolio Results
The following yield table presents the investment income, investment portfolio gains (losses), annualized yields on average ending assets and ending
carrying value for each of the asset classes within the investment portfolio, as well as investment income and investment portfolio gains (losses) for the
investment portfolio as a whole. The yield table also presents gains (losses) on derivative instruments which are used to manage risk for certain invested
assets and certain insurance liabilities:
At and for the Years Ended December 31,
2011 2010 2009
(In millions)
Fixed Maturity Securities:
Yield (1) ....................................................................... 4.94% 5.54% 5.75%
Investment income(2),(3),(4) ........................................................ $ 15,016 $ 12,567 $ 11,827
Investment gains (losses)(3) ........................................................ $ (932) $ (255) $ (1,658)
Ending carrying value(2),(3) ........................................................ $351,011 $325,391 $228,070
Mortgage Loans:
Yield(1) ........................................................................ 5.53% 5.51% 5.38%
Investment income(3),(4) .......................................................... $ 3,162 $ 2,821 $ 2,734
Investment gains (losses)(3) ........................................................ $ 175 $ 22 $ (442)
Ending carrying value(3) ........................................................... $ 61,303 $ 55,457 $ 50,824
Real Estate and Real Estate Joint Ventures:
Yield(1) ........................................................................ 3.76% 1.10% (7.47)%
Investment income(3) ............................................................. $ 307 $ 77 $ (541)
Investment gains (losses)(3) ........................................................ $ 230 $ (40) $ (156)
Ending carrying value ............................................................. $ 8,563 $ 8,030 $ 6,896
Policy Loans:
Yield(1) ........................................................................ 5.43% 6.38% 6.49%
Investment income .............................................................. $ 641 $ 649 $ 641
Ending carrying value ............................................................. $ 11,892 $ 11,761 $ 9,932
Equity Securities:
Yield(1) ........................................................................ 4.44% 4.40% 5.12%
Investment income .............................................................. $ 141 $ 128 $ 176
Investment gains (losses) .......................................................... $ (23) $ 104 $ (399)
Ending carrying value ............................................................. $ 3,023 $ 3,602 $ 3,081
Other Limited Partnership Interests:
Yield(1) ........................................................................ 10.58% 14.99% 3.22%
Investment income .............................................................. $ 681 $ 879 $ 174
Investment gains (losses) .......................................................... $ 4 $ (18) $ (356)
Ending carrying value ............................................................. $ 6,378 $ 6,416 $ 5,508
Cash and Short-Term Investments:
Yield(1), (5) ..................................................................... 1.04% 0.61% 0.53%
Investment income .............................................................. $ 155 $ 81 $ 93
Investment gains (losses) .......................................................... $ 2 $ 2 $ 6
Ending carrying value(3) ........................................................... $ 27,750 $ 22,302 $ 18,385
Other Invested Assets:(1)
Investment income .............................................................. $ 454 $ 492 $ 335
Investment gains (losses)(3) ........................................................ $ (9) $ (8) $ (32)
Ending carrying value ............................................................. $ 23,628 $ 15,430 $ 12,697
Total Investments:
Investment income yield(1) ........................................................ 5.01% 5.51% 5.08%
Investment fees and expenses yield ................................................. (0.13) (0.14) (0.14)
Net Investment Income Yield(1), (3),(5) ........................................... 4.88% 5.37% 4.94%
Investment income .............................................................. $ 20,557 $ 17,694 $ 15,439
Investment fees and expenses ..................................................... (546) (465) (432)
Net investment income including divested businesses ................................... $ 20,011 $ 17,229 $ 15,007
Less: net investment income from divested businesses(5) ................................ (335) (349) (407)
Net Investment Income(3) ...................................................... $ 19,676 $ 16,880 $ 14,600
Ending Carrying Value(3) ....................................................... $493,548 $448,389 $335,393
Investment portfolio gains (losses) including divested businesses ........................... $ (553) $ (193) $ (3,037)
Less: investment portfolio gains (losses) from divested businesses(5) ....................... 140 33 129
Investment portfolio gains (losses)(3),(5),(6) ............................................ $ (413) $ (160) $ (2,908)
Gross investment gains ........................................................... $ 1,354 $ 1,180 $ 1,226
Gross investment losses .......................................................... (1,058) (840) (1,393)
Writedowns .................................................................... (709) (500) (2,741)
Investment Portfolio Gains (Losses)(3),(5),(6) ...................................... $ (413) $ (160) $ (2,908)
Investment portfolio gains (losses) income tax (expense) benefit ............................ 148 46 1,068
Investment Portfolio Gains (Losses), Net of Income Tax ............................ $ (265) $ (114) $ (1,840)
Derivative gains (losses) including divested businesses .................................. $ 4,545 $ (614) $ (5,106)
Less: derivative gains (losses) from divested businesses(5) ............................... 163 41 (2)
Derivative gains (losses)(3),(5),(6) .................................................... $ 4,708 $ (573) $ (5,108)
Derivative gains (losses) income tax (expense) benefit ................................... (1,643) 144 1,804
Derivative Gains (Losses), Net of Income Tax ..................................... $ 3,065 $ (429) $ (3,304)
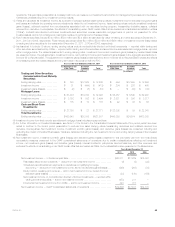
As described in the footnotes below, the yield table reflects certain differences from the presentation of invested assets, net investment income, net
investment gains (losses) and net derivative gains (losses) as presented in the consolidated balance sheets and consolidated statements of
42 MetLife, Inc.