MetLife 2011 Annual Report Download - page 32
Download and view the complete annual report
Please find page 32 of the 2011 MetLife annual report below. You can navigate through the pages in the report by either clicking on the pages listed below, or by using the keyword search tool below to find specific information within the annual report.-
 1
1 -
2
-
3
-
4
-
5
-
6
-
7
-
8
-
9
-
10
-
11
-
12
-
13
-
14
-
15
-
16
-
17
-
18
-
19
-
20
-
21
-
 22
22 -
 23
23 -
 24
24 -
 25
25 -
 26
26 -
 27
27 -
 28
28 -
 29
29 -
 30
30 -
 31
31 -
 32
32 -
 33
33 -
 34
34 -
 35
35 -
 36
36 -
 37
37 -
 38
38 -
 39
39 -
 40
40 -
 41
41 -
 42
42 -
43
-
44
-
45
-
46
-
47
-
48
-
49
-
50
-
51
-
52
-
53
-
54
-
55
-
56
-
57
-
58
-
59
-
60
-
61
-
62
-
63
-
64
-
65
-
66
-
67
-
68
-
69
-
70
-
71
-
72
-
73
-
74
-
75
-
76
-
77
-
78
-
79
-
80
-
81
-
82
-
83
-
84
-
85
-
86
-
87
-
88
-
89
-
90
-
91
-
92
-
93
-
94
-
95
-
96
-
97
-
98
-
99
-
100
-
101
-
102
-
103
-
104
-
105
-
106
-
107
-
108
-
109
-
110
-
111
-
112
-
113
-
114
-
115
-
116
-
117
-
118
-
119
-
120
-
121
-
122
-
123
-
124
-
125
-
126
-
127
-
128
-
129
-
130
-
131
-
132
-
133
-
134
-
135
-
136
-
137
-
138
-
139
-
140
-
141
-
142
-
143
-
144
-
145
-
146
-
147
-
148
-
149
-
150
-
151
-
152
-
153
-
154
-
155
-
156
-
157
-
158
-
159
-
160
-
161
-
162
-
163
-
164
-
165
-
166
-
167
-
168
-
169
-
170
-
171
-
172
-
173
-
174
-
175
-
176
-
177
-
178
-
179
-
180
-
181
-
182
-
183
-
184
-
185
-
186
-
187
-
188
-
189
-
190
-
191
-
192
-
193
-
194
-
195
-
196
-
197
-
198
-
199
-
200
-
201
-
202
-
203
-
204
-
205
-
206
-
207
-
208
-
209
-
210
-
211
-
212
-
213
-
214
-
215
-
216
-
217
-
218
-
219
-
220
-
221
-
222
-
223
-
224
-
225
-
226
-
227
-
228
-
229
-
230
-
231
-
232
-
233
-
234
-
235
-
236
-
237
-
238
-
239
-
240
-
241
-
242
-
243
 |
 |

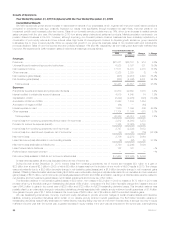
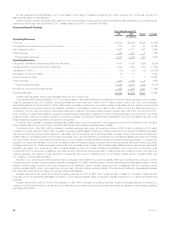
Results of Operations
Year Ended December 31, 2010 Compared with the Year Ended December 31, 2009
Consolidated Results
We have experienced growth and an increase in market share in several of our businesses, which, together with improved overall market conditions
compared to conditions a year ago, positively impacted our results most significantly through increased net cash flows, improved yields on our
investment portfolio and increased policy fee income. Sales of our domestic annuity products were up 14%, driven by an increase in variable annuity
sales compared with the prior year. We benefited in 2010 from strong sales of structured settlement products. Market penetration continues in our
pension closeout business in the U.K.; however, although improving, our domestic pension closeout business has been adversely impacted by a
combination of poor equity returns and lower interest rates. High levels of unemployment continue to depress growth across our group insurance
businesses due to lower covered payrolls. While we experienced growth in our group life business, sales of non-medical health and individual life
products declined. Sales of new homeowner and auto policies increased 11% and 4%, respectively, as the housing and automobile markets have
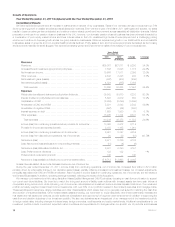
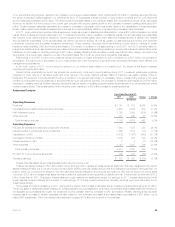
improved. We experienced a 30% increase in sales of retirement and savings products abroad. Years Ended December 31,
2010 2009 Change % Change
(In millions)
Revenues
Premiums ........................................................................ $27,071 $26,157 $ 914 3.5%
Universal life and investment-type product policy fees ...................................... 6,028 5,197 831 16.0%
Net investment income .............................................................. 17,511 14,741 2,770 18.8%
Other revenues .................................................................... 2,328 2,329 (1) —%
Net investment gains (losses) ......................................................... (408) (2,901) 2,493 85.9%
Net derivative gains (losses) .......................................................... (265) (4,866) 4,601 94.6%
Total revenues .................................................................. 52,265 40,657 11,608 28.6%
Expenses
Policyholder benefits and claims and policyholder dividends ................................. 30,670 29,652 1,018 3.4%
Interest credited to policyholder account balances ......................................... 4,919 4,845 74 1.5%
Capitalization of DAC ............................................................... (3,299) (2,976) (323) (10.9)%
Amortization of DAC and VOBA ....................................................... 2,843 1,289 1,554
Amortization of negative VOBA ........................................................ (64) — (64)
Interest expense on debt ............................................................ 1,550 1,044 506 48.5%
Other expenses ................................................................... 11,734 11,164 570 5.1%
Total expenses .................................................................. 48,353 45,018 3,335 7.4%
Income (loss) from continuing operations before provision for income tax ....................... 3,912 (4,361) 8,273
Provision for income tax expense (benefit) ............................................... 1,165 (2,025) 3,190
Income (loss) from continuing operations, net of income tax ................................. 2,747 (2,336) 5,083
Income (loss) from discontinued operations, net of income tax ............................... 39 58 (19) (32.8)%
Net income (loss) .................................................................. 2,786 (2,278) 5,064
Less: Net income (loss) attributable to noncontrolling interests ............................... (4) (32) 28 87.5%
Net income (loss) attributable to MetLife, Inc. ............................................. 2,790 (2,246) 5,036
Less: Preferred stock dividends ....................................................... 122 122 — —%
Preferred stock redemption premium ................................................... — — — —%
Net income (loss) available to MetLife, Inc.’s common shareholders ........................... $ 2,668 $ (2,368) $ 5,036
Unless otherwise stated, all amounts discussed below are net of income tax.
During the year ended December 31, 2010, income (loss) from continuing operations, net of income tax increased $5.1 billion to a gain of
$2.8 billion from a loss of $2.3 billion in 2009, of which $2 million in losses was from the inclusion of one month of ALICO results in 2010. The change
was predominantly due to a $3.0 billion favorable change in net derivative gains (losses) and a $1.6 billion favorable change in net investment gains
(losses). Offsetting these favorable variances totaling $4.6 billion were unfavorable changes in adjustments related to net derivative and net investment
gains (losses) of $518 million, net of income tax, principally associated with DAC and VOBA amortization, resulting in a total favorable variance related to
net derivative and net investment gains (losses), net of related adjustments and income tax, of $4.1 billion.
The favorable variance in net derivative gains (losses) of $3.0 billion, from losses of $3.2 billion in 2009 to losses of $172 million in 2010 was
primarily driven by a favorable change in freestanding derivatives of $4.4 billion, comprised of a $4.5 billion favorable change from losses in the prior
year of $4.3 billion to gains in the current year of $203 million and $123 million in ALICO freestanding derivative losses. This favorable variance was
partially offset by an unfavorable change in embedded derivatives primarily associated with variable annuity minimum benefit guarantees of $1.4 billion
from gains in the prior year of $1.1 billion to losses in the current year of $257 million, net of $5 million in ALICO embedded derivative gains.
We use freestanding interest rate, currency, credit and equity derivatives to provide economic hedges of certain invested assets and insurance
liabilities, including embedded derivatives within certain of our variable annuity minimum benefit guarantees. The $4.5 billion favorable variance in
freestanding derivatives was primarily attributable to market factors, including falling long-term and mid-term interest rates, a stronger recovery in equity
markets in the prior year than the current year, a greater decrease in equity volatility in the prior year as compared to the current year, a strengthening
28 MetLife, Inc.