MetLife 2011 Annual Report Download - page 29
Download and view the complete annual report
Please find page 29 of the 2011 MetLife annual report below. You can navigate through the pages in the report by either clicking on the pages listed below, or by using the keyword search tool below to find specific information within the annual report.-
 1
1 -
2
-
3
-
4
-
5
-
6
-
7
-
8
-
9
-
10
-
11
-
12
-
13
-
14
-
15
-
16
-
17
-
18
-
 19
19 -
 20
20 -
 21
21 -
 22
22 -
 23
23 -
 24
24 -
 25
25 -
 26
26 -
 27
27 -
 28
28 -
 29
29 -
 30
30 -
 31
31 -
 32
32 -
 33
33 -
 34
34 -
 35
35 -
 36
36 -
 37
37 -
 38
38 -
 39
39 -
40
-
41
-
42
-
43
-
44
-
45
-
46
-
47
-
48
-
49
-
50
-
51
-
52
-
53
-
54
-
55
-
56
-
57
-
58
-
59
-
60
-
61
-
62
-
63
-
64
-
65
-
66
-
67
-
68
-
69
-
70
-
71
-
72
-
73
-
74
-
75
-
76
-
77
-
78
-
79
-
80
-
81
-
82
-
83
-
84
-
85
-
86
-
87
-
88
-
89
-
90
-
91
-
92
-
93
-
94
-
95
-
96
-
97
-
98
-
99
-
100
-
101
-
102
-
103
-
104
-
105
-
106
-
107
-
108
-
109
-
110
-
111
-
112
-
113
-
114
-
115
-
116
-
117
-
118
-
119
-
120
-
121
-
122
-
123
-
124
-
125
-
126
-
127
-
128
-
129
-
130
-
131
-
132
-
133
-
134
-
135
-
136
-
137
-
138
-
139
-
140
-
141
-
142
-
143
-
144
-
145
-
146
-
147
-
148
-
149
-
150
-
151
-
152
-
153
-
154
-
155
-
156
-
157
-
158
-
159
-
160
-
161
-
162
-
163
-
164
-
165
-
166
-
167
-
168
-
169
-
170
-
171
-
172
-
173
-
174
-
175
-
176
-
177
-
178
-
179
-
180
-
181
-
182
-
183
-
184
-
185
-
186
-
187
-
188
-
189
-
190
-
191
-
192
-
193
-
194
-
195
-
196
-
197
-
198
-
199
-
200
-
201
-
202
-
203
-
204
-
205
-
206
-
207
-
208
-
209
-
210
-
211
-
212
-
213
-
214
-
215
-
216
-
217
-
218
-
219
-
220
-
221
-
222
-
223
-
224
-
225
-
226
-
227
-
228
-
229
-
230
-
231
-
232
-
233
-
234
-
235
-
236
-
237
-
238
-
239
-
240
-
241
-
242
-
243
 |
 |

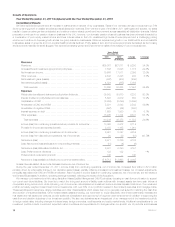
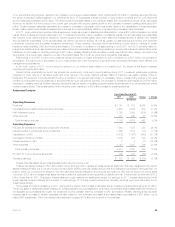
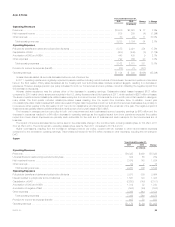
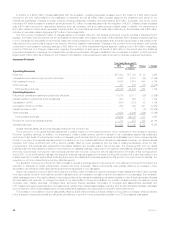
Auto & Home
Years Ended December 31,
Change % Change2011 2010
(In millions)
Operating Revenues
Premiums .......................................................................... $3,000 $2,923 $ 77 2.6%
Net investment income ............................................................... 205 209 (4) (1.9)%
Other revenues ..................................................................... 33 22 11 50.0%
Total operating revenues ............................................................ 3,238 3,154 84 2.7%
Operating Expenses
Policyholder benefits and claims and policyholder dividends ................................... 2,375 2,021 354 17.5%
Capitalization of DAC ................................................................. (453) (448) (5) (1.1)%
Amortization of DAC and VOBA ......................................................... 448 439 9 2.1%
Other expenses ..................................................................... 792 769 23 3.0%
Total operating expenses ............................................................ 3,162 2,781 381 13.7%
Provision for income tax expense (benefit) ................................................. (28) 73 (101)
Operating earnings ................................................................... $ 104 $ 300 $(196) (65.3)%
Unless otherwise stated, all amounts discussed below are net of income tax.
In 2011, operating results were negatively impacted by severe weather including record numbers of tornadoes in the second quarter and Hurricane
Irene in the third quarter. Policy sales decreased as the housing and new automobile sales markets remained sluggish, resulting in a decrease in
exposures. However, average premium per policy increased for both our homeowners and auto policies, more than offsetting the negative impact from
the decrease in exposures.
Adverse claims experience was the primary driver of the decrease in operating earnings. Catastrophe-related losses increased $187 million
compared to 2010 mainly due to severe storm activity in the U.S. during the second and third quarters of 2011, which resulted in $261 million of losses.
The second quarter included catastrophe-related losses mainly due to a record number of tornadoes for a one-month period that resulted in damage in
many states. The third quarter included catastrophe-related losses resulting from the impact from Hurricane Irene. In addition, current year
non-catastrophe claim costs increased $75 million as a result of higher claim frequencies in both our auto and homeowners businesses due primarily to
more severe winter weather in the first quarter of 2011 and to non-catastrophe wind and hail through the remainder of the year. The negative impact of
these items was partially offset by additional favorable development of prior year losses of $23 million.
The increase in average premium per policy in both our homeowners and auto businesses improved operating earnings by $60 million and the
decrease in exposures resulted in a $4 million decrease in operating earnings as the negative impact from lower premiums exceeded the positive
impact from lower claims. Exposures are primarily each automobile for the auto line of business and each residence for the homeowners line of
business.
The impact of the items discussed above can be seen in the unfavorable change in the combined ratio, including catastrophes, to 104.9% in 2011
from 94.6% in 2010. The combined ratio, excluding catastrophes, was 89.1% in 2011 compared to 88.1% in 2010.
Higher commissions, resulting from the increase in average premium per policy, coupled with an increase in other volume-related expenses
contributed to the decrease in operating earnings. This increase is included in the $18 million increase in other expenses, including the net change in
DAC.
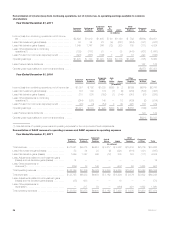
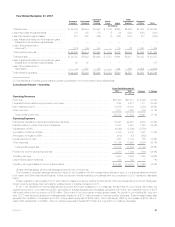
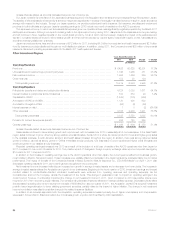
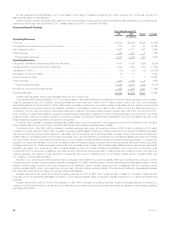
Japan
Years Ended December 31,
Change2011 2010
(In millions)
Operating Revenues
Premiums .................................................................................. $6,325 $ 499 $ 5,826
Universal life and investment-type product policy fees ................................................ 824 55 769
Net investment income ........................................................................ 2,079 145 1,934
Other revenues .............................................................................. 22 7 15
Total operating revenues ..................................................................... 9,250 706 8,544
Operating Expenses
Policyholder benefits and claims and policyholder dividends ........................................... 3,973 309 3,664
Interest credited to policyholder account balances ................................................... 1,561 123 1,438
Capitalization of DAC ......................................................................... (2,250) (149) (2,101)
Amortization of DAC and VOBA ................................................................. 1,312 82 1,230
Amortization of negative VOBA .................................................................. (555) (49) (506)
Other expenses ............................................................................. 3,398 244 3,154
Total operating expenses .................................................................... 7,439 560 6,879
Provision for income tax expense (benefit) ......................................................... 635 52 583
Operating earnings ........................................................................... $1,176 $ 94 $ 1,082
MetLife, Inc. 25