MetLife 2011 Annual Report Download - page 238
Download and view the complete annual report
Please find page 238 of the 2011 MetLife annual report below. You can navigate through the pages in the report by either clicking on the pages listed below, or by using the keyword search tool below to find specific information within the annual report.-
 1
1 -
2
-
3
-
4
-
5
-
6
-
7
-
8
-
9
-
10
-
11
-
12
-
13
-
14
-
15
-
16
-
17
-
18
-
19
-
20
-
21
-
22
-
23
-
24
-
25
-
26
-
27
-
28
-
29
-
30
-
31
-
32
-
33
-
34
-
35
-
36
-
37
-
38
-
39
-
40
-
41
-
42
-
43
-
44
-
45
-
46
-
47
-
48
-
49
-
50
-
51
-
52
-
53
-
54
-
55
-
56
-
57
-
58
-
59
-
60
-
61
-
62
-
63
-
64
-
65
-
66
-
67
-
68
-
69
-
70
-
71
-
72
-
73
-
74
-
75
-
76
-
77
-
78
-
79
-
80
-
81
-
82
-
83
-
84
-
85
-
86
-
87
-
88
-
89
-
90
-
91
-
92
-
93
-
94
-
95
-
96
-
97
-
98
-
99
-
100
-
101
-
102
-
103
-
104
-
105
-
106
-
107
-
108
-
109
-
110
-
111
-
112
-
113
-
114
-
115
-
116
-
117
-
118
-
119
-
120
-
121
-
122
-
123
-
124
-
125
-
126
-
127
-
128
-
129
-
130
-
131
-
132
-
133
-
134
-
135
-
136
-
137
-
138
-
139
-
140
-
141
-
142
-
143
-
144
-
145
-
146
-
147
-
148
-
149
-
150
-
151
-
152
-
153
-
154
-
155
-
156
-
157
-
158
-
159
-
160
-
161
-
162
-
163
-
164
-
165
-
166
-
167
-
168
-
169
-
170
-
171
-
172
-
173
-
174
-
175
-
176
-
177
-
178
-
179
-
180
-
181
-
182
-
183
-
184
-
185
-
186
-
187
-
188
-
189
-
190
-
191
-
192
-
193
-
194
-
195
-
196
-
197
-
198
-
199
-
200
-
201
-
202
-
203
-
204
-
205
-
206
-
207
-
208
-
209
-
210
-
211
-
212
-
213
-
214
-
215
-
216
-
217
-
218
-
219
-
220
-
221
-
222
-
223
-
224
-
225
-
226
-
227
-
 228
228 -
 229
229 -
 230
230 -
 231
231 -
 232
232 -
 233
233 -
 234
234 -
 235
235 -
 236
236 -
 237
237 -
 238
238 -
 239
239 -
 240
240 -
 241
241 -
 242
242 -
 243
243
 |
 |

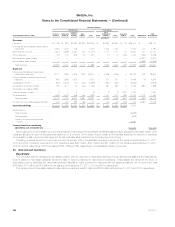
MetLife, Inc.
Notes to the Consolidated Financial Statements — (Continued)
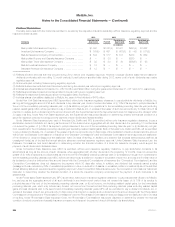
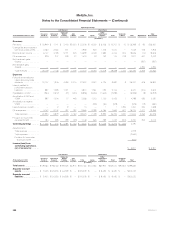
Operating Earnings
Adjustments Total
Consolidated
U.S. Business International
Corporate
& Other TotalYear Ended December 31, 2009 Insurance
Products Retirement
Products
Corporate
Benefit
Funding Auto
& Home Total Japan
Other
International
Regions Total
(In millions)
Revenues
Premiums ........................... $17,168 $ 920 $2,264 $2,902 $23,254 $— $2,884 $2,884 $ 19 $26,157 $ — $26,157
Universal life and investment-type product
policy fees ......................... 2,281 1,543 176 — 4,000 — 1,055 1,055 — 5,055 142 5,197
Net investment income ................. 5,614 3,098 4,527 180 13,419 — 1,111 1,111 70 14,600 141 14,741
Other revenues ....................... 779 173 238 33 1,223 — 14 14 236 1,473 856 2,329
Net investment gains (losses) ............ — — — — — — — — — — (2,901) (2,901)
Net derivative gains (losses) ............. — — — — — — — — — — (4,866) (4,866)
Total revenues ...................... 25,842 5,734 7,205 3,115 41,896 — 5,064 5,064 325 47,285 (6,628) 40,657
Expenses
Policyholder benefits and claims and
policyholder dividends ................ 19,111 1,486 4,245 1,932 26,774 — 2,326 2,326 4 29,104 548 29,652
Interest credited to policyholder account
balances .......................... 952 1,688 1,632 — 4,272 — 577 577 — 4,849 (4) 4,845
Capitalization of DAC ................... (873) (1,067) (14) (435) (2,389) — (587) (587) — (2,976) — (2,976)
Amortization of DAC and VOBA ........... 725 610 15 436 1,786 — 397 397 3 2,186 (897) 1,289
Amortization of negative VOBA ........... — — — — — — — — — — — —
Interest expense on debt ................ 6 — 3 — 9 — 8 8 1,027 1,044 — 1,044
Other expenses ....................... 4,206 2,403 456 764 7,829 — 1,737 1,737 586 10,152 1,012 11,164
Total expenses ..................... 24,127 5,120 6,337 2,697 38,281 — 4,458 4,458 1,620 44,359 659 45,018
Provision for income tax expense (benefit) . . 573 216 288 96 1,173 — 155 155 (756) 572 (2,597) (2,025)
Operating earnings .................. $ 1,142 $ 398 $ 580 $ 322 $ 2,442 $— $ 451 $ 451 $ (539) 2,354
Adjustments to:
Total revenues ...................... (6,628)
Total expenses ..................... (659)
Provision for income tax (expense)
benefit .......................... 2,597
Income (loss) from continuing
operations, net of income tax ....... $ (2,336) $ (2,336)
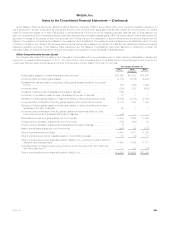
Net investment income is based upon the actual results of each segment’s specifically identifiable asset portfolio adjusted for allocated equity. Other
costs are allocated to each of the segments based upon: (i) a review of the nature of such costs; (ii) time studies analyzing the amount of employee
compensation costs incurred by each segment; and (iii) cost estimates included in the Company’s product pricing.
Operating revenues derived from any customer did not exceed 10% of consolidated operating revenues for the years ended December 31, 2011,
2010 and 2009. Operating revenues from U.S. operations were $44.7 billion, $43.7 billion and $41.4 billion for the years ended December 31, 2011,
2010 and 2009, respectively, which represented 68%, 85% and 88%, respectively, of consolidated operating revenues.
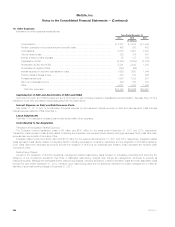
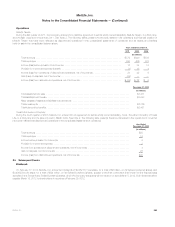
23. Discontinued Operations
Real Estate
The Company actively manages its real estate portfolio with the objective of maximizing earnings through selective acquisitions and dispositions.
Income related to real estate classified as held-for-sale or sold is presented in discontinued operations. These assets are carried at the lower of
depreciated cost or estimated fair value less expected disposition costs. Income from discontinued real estate operations, net of income tax, was
$64 million, $11 million and $19 million for the years ended December 31, 2011, 2010 and 2009, respectively.
The carrying value of real estate related to discontinued operations was $1 million and $184 million at December 31, 2011 and 2010, respectively.
234 MetLife, Inc.