MetLife 2011 Annual Report Download - page 50
Download and view the complete annual report
Please find page 50 of the 2011 MetLife annual report below. You can navigate through the pages in the report by either clicking on the pages listed below, or by using the keyword search tool below to find specific information within the annual report.-
 1
1 -
2
-
3
-
4
-
5
-
6
-
7
-
8
-
9
-
10
-
11
-
12
-
13
-
14
-
15
-
16
-
17
-
18
-
19
-
20
-
21
-
22
-
23
-
24
-
25
-
26
-
27
-
28
-
29
-
30
-
31
-
32
-
33
-
34
-
35
-
36
-
37
-
38
-
39
-
 40
40 -
 41
41 -
 42
42 -
 43
43 -
 44
44 -
 45
45 -
 46
46 -
 47
47 -
 48
48 -
 49
49 -
 50
50 -
 51
51 -
 52
52 -
 53
53 -
 54
54 -
 55
55 -
 56
56 -
 57
57 -
 58
58 -
 59
59 -
 60
60 -
61
-
62
-
63
-
64
-
65
-
66
-
67
-
68
-
69
-
70
-
71
-
72
-
73
-
74
-
75
-
76
-
77
-
78
-
79
-
80
-
81
-
82
-
83
-
84
-
85
-
86
-
87
-
88
-
89
-
90
-
91
-
92
-
93
-
94
-
95
-
96
-
97
-
98
-
99
-
100
-
101
-
102
-
103
-
104
-
105
-
106
-
107
-
108
-
109
-
110
-
111
-
112
-
113
-
114
-
115
-
116
-
117
-
118
-
119
-
120
-
121
-
122
-
123
-
124
-
125
-
126
-
127
-
128
-
129
-
130
-
131
-
132
-
133
-
134
-
135
-
136
-
137
-
138
-
139
-
140
-
141
-
142
-
143
-
144
-
145
-
146
-
147
-
148
-
149
-
150
-
151
-
152
-
153
-
154
-
155
-
156
-
157
-
158
-
159
-
160
-
161
-
162
-
163
-
164
-
165
-
166
-
167
-
168
-
169
-
170
-
171
-
172
-
173
-
174
-
175
-
176
-
177
-
178
-
179
-
180
-
181
-
182
-
183
-
184
-
185
-
186
-
187
-
188
-
189
-
190
-
191
-
192
-
193
-
194
-
195
-
196
-
197
-
198
-
199
-
200
-
201
-
202
-
203
-
204
-
205
-
206
-
207
-
208
-
209
-
210
-
211
-
212
-
213
-
214
-
215
-
216
-
217
-
218
-
219
-
220
-
221
-
222
-
223
-
224
-
225
-
226
-
227
-
228
-
229
-
230
-
231
-
232
-
233
-
234
-
235
-
236
-
237
-
238
-
239
-
240
-
241
-
242
-
243
 |
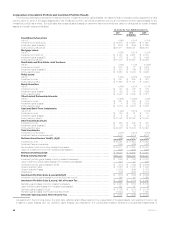
 |

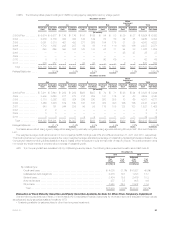
December 31, 2011
Fair Value Measurements Using
Quoted
Prices in
Active
Markets for
Identical Assets
(Level 1)
Significant
Other
Observable
Inputs
(Level 2)
Significant
Unobservable
Inputs
(Level 3)
Total
Estimated
Fair Value
(In millions)
Fixed Maturity Securities:
U.S. corporate securities .................................................... $ — $ 99,001 $ 6,784 $105,785
Foreign corporate securities .................................................. — 59,648 4,370 64,018
Foreign government securities ................................................ 76 50,138 2,322 52,536
Residential mortgage-backed securities (“RMBS”) ................................. — 41,035 1,602 42,637
U.S. Treasury and agency securities ........................................... 19,911 20,070 31 40,012
Commercial mortgage-backed securities (“CMBS”) ................................ — 18,316 753 19,069
State and political subdivision securities ......................................... — 13,182 53 13,235
Asset-backed securities (“ABS”) ............................................... — 11,129 1,850 12,979
Other fixed maturity securities ................................................. — — — —
Total fixed maturity securities ............................................... $19,987 $312,519 $17,765 $350,271
Equity Securities:
Common stock ............................................................ $ 819 $ 1,105 $ 281 $ 2,205
Non-redeemable preferred stock .............................................. — 380 438 818
Total equity securities ..................................................... $ 819 $ 1,485 $ 719 $ 3,023
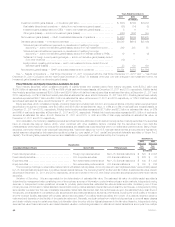
The composition of fair value pricing sources for and significant changes in Level 3 securities at December 31, 2011 are as follows:
• The majority of the Level 3 fixed maturity and equity securities (83%, as presented above) were concentrated in four sectors: U.S. and foreign
corporate securities, foreign government securities and ABS.
• Level 3 fixed maturity securities are priced principally through market standard valuation methodologies, independent pricing services and
independent non-binding broker quotations using inputs that are not market observable or cannot be derived principally from or corroborated
by observable market data. Level 3 fixed maturity securities consist of less liquid fixed maturity securities with very limited trading activity or
where less price transparency exists around the inputs to the valuation methodologies including alternative residential mortgage loan (“Alt-A”)
and sub-prime RMBS and less liquid prime RMBS, certain below investment grade private placements and less liquid investment grade
corporate securities (included in U.S. and foreign corporate securities), less liquid foreign government securities and less liquid ABS.
• During the year ended December 31, 2011, Level 3 fixed maturity securities decreased by $5.0 billion, or 22%. The decrease was driven by
net transfers out of Level 3, partially offset by net purchases in excess of sales and increase in estimated fair value recognized in accumulated
other comprehensive income (loss). See analysis of transfers into and/or out of Level 3 below. The increase in net purchases in excess of
sales of fixed maturity securities were concentrated in ABS and foreign government securities, and the increase in estimated fair value
recognized in accumulated other comprehensive income (loss) for fixed maturity securities was concentrated in U.S. corporate securities due
in part to a decrease in interest rates.
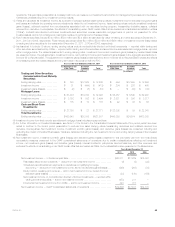
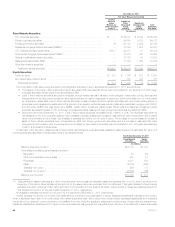
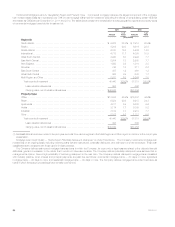
A rollforward of the fair value measurements for fixed maturity securities and equity securities available-for-sale measured at estimated fair value on a
recurring basis using significant unobservable (Level 3) inputs is as follows:
Year Ended December 31, 2011
Fixed Maturity
Securities Equity
Securities
(In millions)
Balance, beginning of period .......................................................... $22,716 $1,173
Total realized/unrealized gains (losses) included in:
Earnings(1) ...................................................................... 48 (57)
Other comprehensive income (loss) ................................................... 403 10
Purchases ....................................................................... 4,907 109
Sales ........................................................................... (4,219) (462)
Transfers into Level 3 .............................................................. 599 12
Transfers out of Level 3 ............................................................ (6,689) (66)
Balance, end of period ............................................................... $17,765 $ 719
(1) Total gains and losses in earnings and other comprehensive income (loss) are calculated assuming transfers into or out of Level 3 occurred at the
beginning of the period. Items transferred into and out for the same period are excluded from the rollforward. Total gains (losses) for fixed maturity
securities included in earnings of ($7) million and other comprehensive income (loss) of $9 million, were incurred on these securities subsequent to
their transfer into Level 3, for the year ended December 31, 2011, respectively.
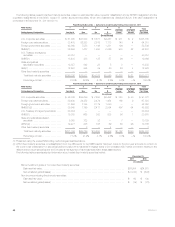
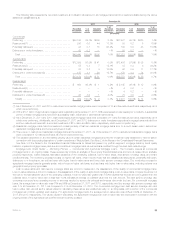
An analysis of transfers into and/or out of Level 3 for the year ended December 31, 2011 is as follows:
Overall, transfers into and/or out of Level 3 are attributable to a change in the observability of inputs. Assets and liabilities are transferred into Level 3
when a significant input cannot be corroborated with market observable data. This occurs when market activity decreases significantly and underlying
inputs cannot be observed, current prices are not available, and when there are significant variances in quoted prices, thereby affecting transparency.
Assets and liabilities are transferred out of Level 3 when circumstances change such that a significant input can be corroborated with market observable
46 MetLife, Inc.