MetLife 2011 Annual Report Download - page 225
Download and view the complete annual report
Please find page 225 of the 2011 MetLife annual report below. You can navigate through the pages in the report by either clicking on the pages listed below, or by using the keyword search tool below to find specific information within the annual report.-
 1
1 -
2
-
3
-
4
-
5
-
6
-
7
-
8
-
9
-
10
-
11
-
12
-
13
-
14
-
15
-
16
-
17
-
18
-
19
-
20
-
21
-
22
-
23
-
24
-
25
-
26
-
27
-
28
-
29
-
30
-
31
-
32
-
33
-
34
-
35
-
36
-
37
-
38
-
39
-
40
-
41
-
42
-
43
-
44
-
45
-
46
-
47
-
48
-
49
-
50
-
51
-
52
-
53
-
54
-
55
-
56
-
57
-
58
-
59
-
60
-
61
-
62
-
63
-
64
-
65
-
66
-
67
-
68
-
69
-
70
-
71
-
72
-
73
-
74
-
75
-
76
-
77
-
78
-
79
-
80
-
81
-
82
-
83
-
84
-
85
-
86
-
87
-
88
-
89
-
90
-
91
-
92
-
93
-
94
-
95
-
96
-
97
-
98
-
99
-
100
-
101
-
102
-
103
-
104
-
105
-
106
-
107
-
108
-
109
-
110
-
111
-
112
-
113
-
114
-
115
-
116
-
117
-
118
-
119
-
120
-
121
-
122
-
123
-
124
-
125
-
126
-
127
-
128
-
129
-
130
-
131
-
132
-
133
-
134
-
135
-
136
-
137
-
138
-
139
-
140
-
141
-
142
-
143
-
144
-
145
-
146
-
147
-
148
-
149
-
150
-
151
-
152
-
153
-
154
-
155
-
156
-
157
-
158
-
159
-
160
-
161
-
162
-
163
-
164
-
165
-
166
-
167
-
168
-
169
-
170
-
171
-
172
-
173
-
174
-
175
-
176
-
177
-
178
-
179
-
180
-
181
-
182
-
183
-
184
-
185
-
186
-
187
-
188
-
189
-
190
-
191
-
192
-
193
-
194
-
195
-
196
-
197
-
198
-
199
-
200
-
201
-
202
-
203
-
204
-
205
-
206
-
207
-
208
-
209
-
210
-
211
-
212
-
213
-
214
-
 215
215 -
 216
216 -
 217
217 -
 218
218 -
 219
219 -
 220
220 -
 221
221 -
 222
222 -
 223
223 -
 224
224 -
 225
225 -
 226
226 -
 227
227 -
 228
228 -
 229
229 -
 230
230 -
 231
231 -
 232
232 -
 233
233 -
 234
234 -
 235
235 -
236
-
237
-
238
-
239
-
240
-
241
-
242
-
243
 |
 |

MetLife, Inc.
Notes to the Consolidated Financial Statements — (Continued)
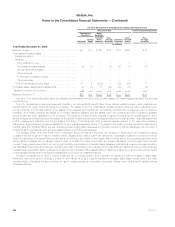
The binomial lattice model used by the Company incorporates different risk-free rates based on the imputed forward rates for U.S. Treasury Strips for
each year over the contractual term of the option. The table below presents the full range of rates that were used for options granted during the
respective periods.
Dividend yield is determined based on historical dividend distributions compared to the price of the underlying common stock as of the valuation
date and held constant over the life of the Stock Option.
The binomial lattice model used by the Company incorporates the contractual term of the Stock Options and then factors in expected exercise
behavior and a post-vesting termination rate, or the rate at which vested options are exercised or expire prematurely due to termination of employment,
to derive an expected life. Exercise behavior in the binomial lattice model used by the Company is expressed using an exercise multiple, which reflects
the ratio of exercise price to the strike price of Stock Options granted at which holders of the Stock Options are expected to exercise. The exercise
multiple is derived from actual historical exercise activity. The post-vesting termination rate is determined from actual historical exercise experience and
expiration activity under the Incentive Plans.
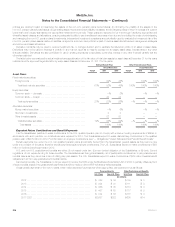
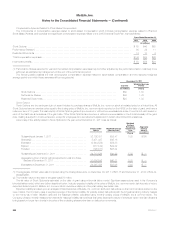
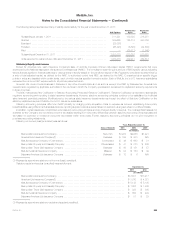
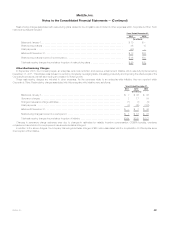
The following table presents the weighted average assumptions, with the exception of risk-free rate, which is expressed as a range, used to
determine the fair value of Stock Options issued:
Years Ended December 31,
2011 2010 2009
Dividend yield ................................................... 1.65% 2.11% 3.15%
Risk-free rate of return ............................................ 0.29%-5.51% 0.35%-5.88% 0.73%-6.67%
Expected volatility ................................................ 32.64% 34.41% 44.39%
Exercise multiple ................................................. 1.69 1.75 1.76
Post-vesting termination rate ........................................ 3.36% 3.64% 3.70%
Contractual term (years) ........................................... 10 10 10
Expected life (years) .............................................. 7 7 6
Weighted average exercise price of stock options granted ................ $45.16 $35.06 $23.61
Weighted average fair value of stock options granted .................... $14.27 $11.29 $8.37
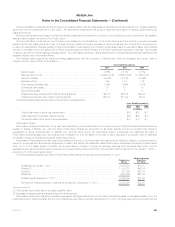
The following table presents a summary of Stock Option exercise activity:
Years Ended December 31,
2011 2010 2009
(In millions)
Total intrinsic value of stock options exercised ................................................ $41 $22 $ 1
Cash received from exercise of stock options ................................................ $88 $52 $ 8
Tax benefit realized from stock options exercised ............................................. $14 $ 8 $—
Performance Shares
Performance Shares are units that, if they vest, are multiplied by a performance factor to produce a number of final Performance Shares which are
payable in shares of MetLife, Inc. common stock. Performance Shares are accounted for as equity awards, but are not credited with dividend-
equivalents for actual dividends paid on MetLife, Inc. common stock during the performance period. Accordingly, the estimated fair value of
Performance Shares is based upon the closing price of MetLife, Inc. common stock on the date of grant, reduced by the present value of estimated
dividends to be paid on that stock during the performance period.
Performance Share awards normally vest in their entirety at the end of the three-year performance period. Vesting is subject to continued service,
except for employees who are retirement eligible and in certain other limited circumstances. Vested Performance Shares are multiplied by a performance
factor of 0.0 to 2.0 based largely on MetLife, Inc.’s performance in change in annual net operating earnings and total shareholder return over the
applicable three-year performance period compared to the performance of its competitors. The performance factor was 0.90 for the January 1, 2008 —
December 31, 2010 performance period.
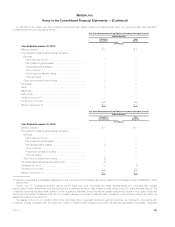
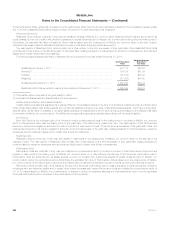
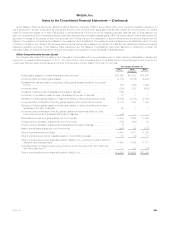
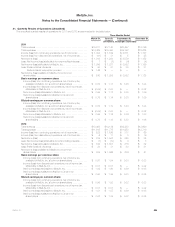
The following table presents a summary of Performance Share activity for the year ended December 31, 2011:
Performance
Shares
Weighted Average
Grant Date
Fair Value
Outstanding at January 1, 2011 .................................................... 4,155,574 $31.91
Granted(1) ..................................................................... 1,783,070 $42.84
Forfeited ...................................................................... (89,725) $32.79
Payable(2) ..................................................................... (824,825) $57.95
Outstanding at December 31, 2011 ................................................. 5,024,094 $31.50
Performance Shares expected to vest at a future date as of December 31, 2011 .............. 4,729,890 $32.35
(1) The total fair value on the date of the grant was $76 million.
(2) Includes both shares paid and shares deferred for later payment.
Performance Share amounts above represent aggregate initial target awards and do not reflect potential increases or decreases resulting from the
performance factor determined after the end of the respective performance periods. At December 31, 2011, the three year performance period for the
MetLife, Inc. 221