MetLife 2011 Annual Report Download - page 92
Download and view the complete annual report
Please find page 92 of the 2011 MetLife annual report below. You can navigate through the pages in the report by either clicking on the pages listed below, or by using the keyword search tool below to find specific information within the annual report.-
 1
1 -
2
-
3
-
4
-
5
-
6
-
7
-
8
-
9
-
10
-
11
-
12
-
13
-
14
-
15
-
16
-
17
-
18
-
19
-
20
-
21
-
22
-
23
-
24
-
25
-
26
-
27
-
28
-
29
-
30
-
31
-
32
-
33
-
34
-
35
-
36
-
37
-
38
-
39
-
40
-
41
-
42
-
43
-
44
-
45
-
46
-
47
-
48
-
49
-
50
-
51
-
52
-
53
-
54
-
55
-
56
-
57
-
58
-
59
-
60
-
61
-
62
-
63
-
64
-
65
-
66
-
67
-
68
-
69
-
70
-
71
-
72
-
73
-
74
-
75
-
76
-
77
-
78
-
79
-
80
-
81
-
 82
82 -
 83
83 -
 84
84 -
 85
85 -
 86
86 -
 87
87 -
 88
88 -
 89
89 -
 90
90 -
 91
91 -
 92
92 -
 93
93 -
 94
94 -
 95
95 -
 96
96 -
 97
97 -
 98
98 -
 99
99 -
 100
100 -
 101
101 -
 102
102 -
103
-
104
-
105
-
106
-
107
-
108
-
109
-
110
-
111
-
112
-
113
-
114
-
115
-
116
-
117
-
118
-
119
-
120
-
121
-
122
-
123
-
124
-
125
-
126
-
127
-
128
-
129
-
130
-
131
-
132
-
133
-
134
-
135
-
136
-
137
-
138
-
139
-
140
-
141
-
142
-
143
-
144
-
145
-
146
-
147
-
148
-
149
-
150
-
151
-
152
-
153
-
154
-
155
-
156
-
157
-
158
-
159
-
160
-
161
-
162
-
163
-
164
-
165
-
166
-
167
-
168
-
169
-
170
-
171
-
172
-
173
-
174
-
175
-
176
-
177
-
178
-
179
-
180
-
181
-
182
-
183
-
184
-
185
-
186
-
187
-
188
-
189
-
190
-
191
-
192
-
193
-
194
-
195
-
196
-
197
-
198
-
199
-
200
-
201
-
202
-
203
-
204
-
205
-
206
-
207
-
208
-
209
-
210
-
211
-
212
-
213
-
214
-
215
-
216
-
217
-
218
-
219
-
220
-
221
-
222
-
223
-
224
-
225
-
226
-
227
-
228
-
229
-
230
-
231
-
232
-
233
-
234
-
235
-
236
-
237
-
238
-
239
-
240
-
241
-
242
-
243
 |
 |

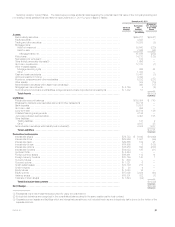
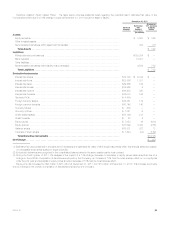
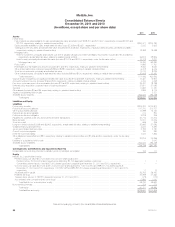
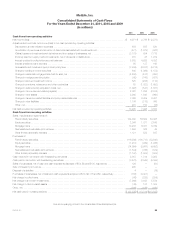
MetLife, Inc.
Consolidated Balance Sheets
December 31, 2011 and 2010
(In millions, except share and per share data)
2011 2010
Assets
Investments:
Fixed maturity securities available-for-sale, at estimated fair value (amortized cost: $329,811 and $317,617, respectively; includes $3,225 and
$3,330, respectively, relating to variable interest entities) ................................................................... $350,271 $324,797
Equity securities available-for-sale, at estimated fair value (cost: $3,208 and $3,621, respectively) .................................... 3,023 3,602
Trading and other securities, at estimated fair value (includes $473 and $463, respectively, of actively traded securities; and $280 and $387,
respectively, relating to variable interest entities) .......................................................................... 18,268 18,589
Mortgage loans:
Held-for-investment, principally at amortized cost (net of valuation allowances of $481 and $664, respectively; includes $3,187 and $6,840,
respectively, at estimated fair value, relating to variable interest entities) ...................................................... 56,915 58,976
Held-for-sale, principally at estimated fair value (includes $10,716 and $2,510, respectively, under the fair value option) ................. 15,178 3,321
Mortgage loans, net ............................................................................................. 72,093 62,297
Policy loans ....................................................................................................... 11,892 11,761
Real estate and real estate joint ventures (includes $15 and $10, respectively, relating to variable interest entities) ........................ 8,563 8,030
Other limited partnership interests (includes $259 and $298, respectively, relating to variable interest entities) ............................ 6,378 6,416
Short-term investments, principally at estimated fair value .................................................................... 17,310 9,384
Other invested assets, principally at estimated fair value (includes $98 and $104, respectively, relating to variable interest entities) ............ 23,628 15,430
Total investments ............................................................................................... 511,426 460,306
Cash and cash equivalents, principally at estimated fair value (includes $176 and $69, respectively, relating to variable interest entities) ......... 10,461 12,957
Accrued investment income (includes $16 and $34, respectively, relating to variable interest entities) .................................... 4,344 4,328
Premiums, reinsurance and other receivables (includes $12 and $2, respectively, relating to variable interest entities) ........................ 22,481 19,799
Deferred policy acquisition costs and value of business acquired ................................................................ 27,971 27,092
Goodwill ............................................................................................................ 11,935 11,781
Other assets (includes $5 and $6, respectively, relating to variable interest entities) .................................................. 7,984 8,174
Assets of subsidiaries held-for-sale ....................................................................................... — 3,331
Separate account assets ............................................................................................... 203,023 183,138
Total assets ................................................................................................... $799,625 $730,906
Liabilities and Equity
Liabilities
Future policy benefits .................................................................................................. $184,252 $170,912
Policyholder account balances .......................................................................................... 217,700 210,757
Other policy-related balances ........................................................................................... 15,599 15,750
Policyholder dividends payable .......................................................................................... 774 830
Policyholder dividend obligation .......................................................................................... 2,919 876
Payables for collateral under securities loaned and other transactions ............................................................. 33,716 27,272
Bank deposits ....................................................................................................... 10,507 10,316
Short-term debt ...................................................................................................... 686 306
Long-term debt (includes $3,068 and $6,902, respectively, at estimated fair value, relating to variable interest entities) ...................... 23,692 27,586
Collateral financing arrangements ........................................................................................ 4,647 5,297
Junior subordinated debt securities ....................................................................................... 3,192 3,191
Current income tax payable ............................................................................................. 193 297
Deferred income tax liability ............................................................................................. 7,535 1,856
Other liabilities (includes $60 and $93, respectively, relating to variable interest entities; and $7,626 and $0, respectively, under the fair value
option) ........................................................................................................... 30,914 20,366
Liabilities of subsidiaries held-for-sale ..................................................................................... — 3,043
Separate account liabilities .............................................................................................. 203,023 183,138
Total liabilities .................................................................................................. 739,349 681,793
Contingencies, Commitments and Guarantees (Note 16)
Redeemable noncontrolling interests in partially owned consolidated subsidiaries ................................................... 105 117
Equity
MetLife, Inc.’s stockholders’ equity:
Preferred stock, par value $0.01 per share; 200,000,000 shares authorized: .....................................................
Preferred stock, 84,000,000 shares issued and outstanding; $2,100 aggregate liquidation preference ............................... 1 1
Convertible preferred stock, 0 and 6,857,000 shares issued and outstanding at December 31, 2011 and 2010, respectively ............. — —
Common stock, par value $0.01 per share; 3,000,000,000 shares authorized; 1,061,150,915 and 989,031,704 shares issued at
December 31, 2011 and 2010, respectively; 1,057,957,028 and 985,837,817 shares outstanding at December 31, 2011 and 2010,
respectively ..................................................................................................... 11 10
Additional paid-in capital .............................................................................................. 26,782 26,423
Retained earnings .................................................................................................. 27,289 21,363
Treasury stock, at cost; 3,193,887 shares at December 31, 2011 and 2010 ..................................................... (172) (172)
Accumulated other comprehensive income (loss) .......................................................................... 5,886 1,000
Total MetLife, Inc.’s stockholders’ equity ............................................................................. 59,797 48,625
Noncontrolling interests ................................................................................................ 374 371
Total equity .................................................................................................... 60,171 48,996
Total liabilities and equity .......................................................................................... $799,625 $730,906
See accompanying notes to the consolidated financial statements.
88 MetLife, Inc.