MetLife 2011 Annual Report Download - page 26
Download and view the complete annual report
Please find page 26 of the 2011 MetLife annual report below. You can navigate through the pages in the report by either clicking on the pages listed below, or by using the keyword search tool below to find specific information within the annual report.-
 1
1 -
2
-
3
-
4
-
5
-
6
-
7
-
8
-
9
-
10
-
11
-
12
-
13
-
14
-
15
-
 16
16 -
 17
17 -
 18
18 -
 19
19 -
 20
20 -
 21
21 -
 22
22 -
 23
23 -
 24
24 -
 25
25 -
 26
26 -
 27
27 -
 28
28 -
 29
29 -
 30
30 -
 31
31 -
 32
32 -
 33
33 -
 34
34 -
 35
35 -
 36
36 -
37
-
38
-
39
-
40
-
41
-
42
-
43
-
44
-
45
-
46
-
47
-
48
-
49
-
50
-
51
-
52
-
53
-
54
-
55
-
56
-
57
-
58
-
59
-
60
-
61
-
62
-
63
-
64
-
65
-
66
-
67
-
68
-
69
-
70
-
71
-
72
-
73
-
74
-
75
-
76
-
77
-
78
-
79
-
80
-
81
-
82
-
83
-
84
-
85
-
86
-
87
-
88
-
89
-
90
-
91
-
92
-
93
-
94
-
95
-
96
-
97
-
98
-
99
-
100
-
101
-
102
-
103
-
104
-
105
-
106
-
107
-
108
-
109
-
110
-
111
-
112
-
113
-
114
-
115
-
116
-
117
-
118
-
119
-
120
-
121
-
122
-
123
-
124
-
125
-
126
-
127
-
128
-
129
-
130
-
131
-
132
-
133
-
134
-
135
-
136
-
137
-
138
-
139
-
140
-
141
-
142
-
143
-
144
-
145
-
146
-
147
-
148
-
149
-
150
-
151
-
152
-
153
-
154
-
155
-
156
-
157
-
158
-
159
-
160
-
161
-
162
-
163
-
164
-
165
-
166
-
167
-
168
-
169
-
170
-
171
-
172
-
173
-
174
-
175
-
176
-
177
-
178
-
179
-
180
-
181
-
182
-
183
-
184
-
185
-
186
-
187
-
188
-
189
-
190
-
191
-
192
-
193
-
194
-
195
-
196
-
197
-
198
-
199
-
200
-
201
-
202
-
203
-
204
-
205
-
206
-
207
-
208
-
209
-
210
-
211
-
212
-
213
-
214
-
215
-
216
-
217
-
218
-
219
-
220
-
221
-
222
-
223
-
224
-
225
-
226
-
227
-
228
-
229
-
230
-
231
-
232
-
233
-
234
-
235
-
236
-
237
-
238
-
239
-
240
-
241
-
242
-
243
 |
 |

On an annual basis, we perform experience studies, as well as update our assumptions regarding both expected policyholder behaviors and the
related investment environment. These updates, commonly known as unlocking events, result in changes to certain insurance-related liabilities, DAC
and revenue amortization. The impact of updates to our assumptions in both 2011 and 2010, resulted in a net increase to operating earnings of $23
million, in the current year.
In the fourth quarter of 2011, we announced a reduction in our dividend scale related to our closed block. The impact of this action increased
operating earnings by $54 million.
Severe weather during 2011 was the primary driver of our unfavorable claims experience in Auto & Home, which decreased operating earnings by
$239 million. In addition, in the third quarter of 2011, we incurred a $117 million charge to increase reserves in connection with our use of the Death
Master File, impacting primarily Insurance Products. These events overshadowed favorable claims experience in our dental and disability businesses
and strong mortality gains in our group life business, which, combined, improved operating earnings by $100 million.
Market factors, specifically the current low interest rate environment, continued to be a challenge during 2011. Also in 2011, equity markets
remained relatively flat compared to much stronger 2010 equity market performance. Investment yields were negatively impacted by the current low
interest rate environment and lower returns in the equity markets, partially offset by improving real estate markets, resulting in a $157 million decrease in
net investment income. DAC, VOBA and DSI amortization and certain insurance-related liabilities are sensitive to market fluctuations, which was the
primary driver of higher expenses of $102 million in these categories. In particular, the less favorable 2011 investment markets caused accelerationof
DAC amortization. Partially offsetting these decreases was a $119 million improvement in operating earnings, primarily driven by lower average crediting
rates on our annuity and funding agreement businesses. The lower average crediting rates continue to reflect the lower investment returns available in
the marketplace. Also contributing to the decrease in interest credited is the impact from derivatives that are used to hedge certain liabilities in our
funding agreement business. In addition, growth in our separate accounts due to favorable equity market performance in 2010 and stable equity
markets in 2011 resulted in increased fees and other revenues of $79 million.
Interest expense on debt increased $109 million primarily as a result of debt issued in the third and fourth quarters of 2010 in connection with the
Acquisition and Federal Home Loan Bank (“FHLB”) borrowings.
The Company incurred $40 million of expenses related to a liquidation plan filed by the Department of Financial Services for ELNY in the third quarter
of 2011. Results from our mortgage loan servicing business were lower driven by an increase in expenses of $31 million in response to both a larger
portfolio and increased regulatory oversight.
The Company also benefited from a higher tax benefit in 2011 of $88 million over 2010 primarily due to $75 million of charges in 2010 related to the
Patient Protection and Affordable Care Act and the Health Care and Education Reconciliation Act of 2010 (together, the “Health Care Act”). The Health
Care Act reduced the tax deductibility of retiree health care costs to the extent of any Medicare Part D subsidy received beginning in 2013. Because the
deductibility of future retiree health care costs was reflected in our financial statements, the entire future impact of this change in law was required to be
recorded as a charge in the first quarter of 2010, when the legislation was enacted. The higher tax benefit was also a result of higher utilization of tax
preferenced investments which provide tax credits and deductions.
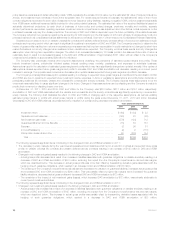
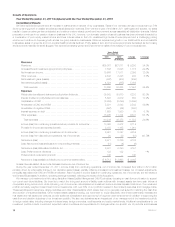
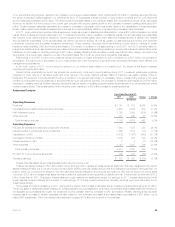
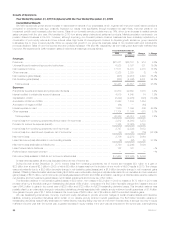
Insurance Products
Years Ended December 31,
Change % Change2011 2010
(In millions)
Operating Revenues
Premiums .......................................................................... $16,949 $17,200 $(251) (1.5)%
Universal life and investment-type product policy fees ........................................ 2,264 2,247 17 0.8%
Net investment income ............................................................... 6,107 6,068 39 0.6%
Other revenues ..................................................................... 829 761 68 8.9%
Total operating revenues ............................................................ 26,149 26,276 (127) (0.5)%
Operating Expenses
Policyholder benefits and claims and policyholder dividends ................................... 18,707 19,075 (368) (1.9)%
Interest credited to policyholder account balances .......................................... 997 963 34 3.5%
Capitalization of DAC ................................................................. (864) (841) (23) (2.7)%
Amortization of DAC and VOBA ......................................................... 897 966 (69) (7.1)%
Interest expense on debt .............................................................. — 1 (1) (100.0)%
Other expenses ..................................................................... 4,143 4,080 63 1.5%
Total operating expenses ............................................................ 23,880 24,244 (364) (1.5)%
Provision for income tax expense (benefit) ................................................. 794 711 83 11.7%
Operating earnings ................................................................... $ 1,475 $ 1,321 $ 154 11.7%
Unless otherwise stated, all amounts discussed below are net of income tax.
Strong underwriting results generated about half of our increase in operating earnings. The remaining increase resulted from the impact of annual
assumption updates, lower policyholder dividends and higher fees from our variable and universal life business. These increases were dampened by the
negative impacts of the sustained low interest rate environment.
Growth in our open block traditional life and in our variable and universal life businesses was more than offset by declines in our group life and
non-medical health businesses, as well as the expected run-off from our closed block business. Sustained high levels of unemployment and a
challenging pricing environment continue to depress growth in many of our group insurance businesses. Our dental business benefited from higher
enrollment and certain pricing actions, but this was more than offset by a decline in revenues from our disability business. This reduction was mainly due
to net customer cancellations and lower covered lives. Our LTC revenues were flat period over period, consistent with the discontinuance of the sale of
this coverage at the end of 2010. Although revenues have declined from the prior year, current year premiums and deposits, along with an expansion
22 MetLife, Inc.