MetLife 2011 Annual Report Download - page 123
Download and view the complete annual report
Please find page 123 of the 2011 MetLife annual report below. You can navigate through the pages in the report by either clicking on the pages listed below, or by using the keyword search tool below to find specific information within the annual report.-
 1
1 -
2
-
3
-
4
-
5
-
6
-
7
-
8
-
9
-
10
-
11
-
12
-
13
-
14
-
15
-
16
-
17
-
18
-
19
-
20
-
21
-
22
-
23
-
24
-
25
-
26
-
27
-
28
-
29
-
30
-
31
-
32
-
33
-
34
-
35
-
36
-
37
-
38
-
39
-
40
-
41
-
42
-
43
-
44
-
45
-
46
-
47
-
48
-
49
-
50
-
51
-
52
-
53
-
54
-
55
-
56
-
57
-
58
-
59
-
60
-
61
-
62
-
63
-
64
-
65
-
66
-
67
-
68
-
69
-
70
-
71
-
72
-
73
-
74
-
75
-
76
-
77
-
78
-
79
-
80
-
81
-
82
-
83
-
84
-
85
-
86
-
87
-
88
-
89
-
90
-
91
-
92
-
93
-
94
-
95
-
96
-
97
-
98
-
99
-
100
-
101
-
102
-
103
-
104
-
105
-
106
-
107
-
108
-
109
-
110
-
111
-
112
-
 113
113 -
 114
114 -
 115
115 -
 116
116 -
 117
117 -
 118
118 -
 119
119 -
 120
120 -
 121
121 -
 122
122 -
 123
123 -
 124
124 -
 125
125 -
 126
126 -
 127
127 -
 128
128 -
 129
129 -
 130
130 -
 131
131 -
 132
132 -
 133
133 -
134
-
135
-
136
-
137
-
138
-
139
-
140
-
141
-
142
-
143
-
144
-
145
-
146
-
147
-
148
-
149
-
150
-
151
-
152
-
153
-
154
-
155
-
156
-
157
-
158
-
159
-
160
-
161
-
162
-
163
-
164
-
165
-
166
-
167
-
168
-
169
-
170
-
171
-
172
-
173
-
174
-
175
-
176
-
177
-
178
-
179
-
180
-
181
-
182
-
183
-
184
-
185
-
186
-
187
-
188
-
189
-
190
-
191
-
192
-
193
-
194
-
195
-
196
-
197
-
198
-
199
-
200
-
201
-
202
-
203
-
204
-
205
-
206
-
207
-
208
-
209
-
210
-
211
-
212
-
213
-
214
-
215
-
216
-
217
-
218
-
219
-
220
-
221
-
222
-
223
-
224
-
225
-
226
-
227
-
228
-
229
-
230
-
231
-
232
-
233
-
234
-
235
-
236
-
237
-
238
-
239
-
240
-
241
-
242
-
243
 |
 |

MetLife, Inc.
Notes to the Consolidated Financial Statements — (Continued)
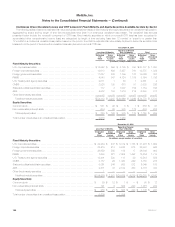
The Company held non-income producing fixed maturity securities with an estimated fair value of $62 million and $130 million with unrealized gains
(losses) of ($19) million and ($23) million at December 31, 2011 and 2010, respectively.
The Company held foreign currency derivatives with notional amounts of $15.3 billion and $12.2 billion to hedge the exchange rate risk associated
with foreign denominated fixed maturity securities at December 31, 2011 and 2010, respectively.
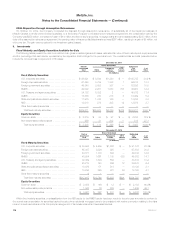
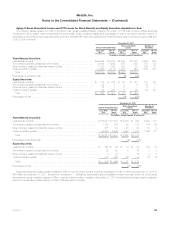
Concentrations of Credit Risk (Fixed Maturity Securities) — Summary. The following section contains a summary of the concentrations of credit risk
related to fixed maturity securities holdings.
The Company was not exposed to any concentrations of credit risk of any single issuer greater than 10% of the Company’s equity, other than the
government securities summarized in the table below. The par value, amortized cost and estimated fair value of holdings in sovereign fixed maturity
securities of Portugal, Ireland, Italy, Greece and Spain, commonly referred to as “Europe’s perimeter region,” was $874 million, $254 million and
$264 million at December 31, 2011, respectively, and $1.9 billion, $1.6 billion and $1.6 billion at December 31, 2010, respectively. The estimated fair
value of these Europe perimeter region sovereign fixed maturity securities represented 0.4% and 3.2% of the Company’s equity at December 31, 2011
and 2010, respectively, and 0.1% and 0.3% of total cash and invested assets at December 31, 2011 and 2010, respectively.
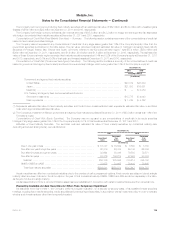
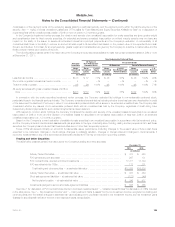
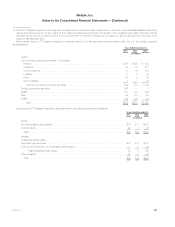
Concentrations of Credit Risk (Government and Agency Securities). The following section contains a summary of the concentrations of credit risk
related to government and agency fixed maturity and fixed-income securities holdings, which were greater than 10% of the Company’s equity at:
December 31,
2011 2010
Carrying Value(1)
(In millions)
Government and agency fixed maturity securities:
United States ................................................................... $40,012 $33,304
Japan ......................................................................... $21,003 $15,591
Mexico(2) ...................................................................... $ — $ 5,050
U.S. Treasury and agency fixed-income securities included in:
Short-term investments ........................................................... $15,775 $ 4,048
Cash equivalents ................................................................ $ 1,748 $ 5,762
(1) Represents estimated fair value for fixed maturity securities, and for short-term investments and cash equivalents, estimated fair value or amortized
cost, which approximates estimated fair value.
(2) The Company’s investment in Mexico government and agency fixed maturity securities at December 31, 2011 of $5.0 billion is less than 10% of the
Company’s equity.
Concentrations of Credit Risk (Equity Securities). The Company was not exposed to any concentrations of credit risk in its equity securities
holdings of any single issuer greater than 10% of the Company’s equity or 1% of total investments at December 31, 2011 and 2010.
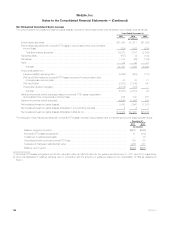
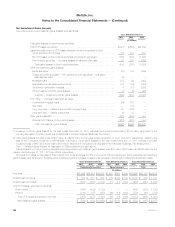
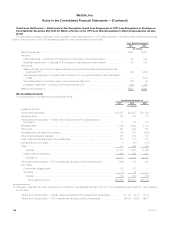
Maturities of Fixed Maturity Securities. The amortized cost and estimated fair value of fixed maturity securities, by contractual maturity date
(excluding scheduled sinking funds), were as follows at:
December 31,
2011 2010
Amortized
Cost
Estimated
Fair
Value Amortized
Cost
Estimated
Fair
Value
(In millions)
Due in one year or less ......................................... $ 16,747 $ 16,862 $ 8,580 $ 8,702
Due after one year through five years ............................... 62,819 64,414 65,143 66,796
Due after five years through ten years .............................. 82,694 88,036 76,508 79,571
Due after ten years ............................................. 93,876 106,274 87,983 90,033
Subtotal ................................................... 256,136 275,586 238,214 245,102
RMBS, CMBS and ABS ......................................... 73,675 74,685 79,403 79,695
Total fixed maturity securities ................................... $329,811 $350,271 $317,617 $324,797
Actual maturities may differ from contractual maturities due to the exercise of call or prepayment options. Fixed maturity securities not due at a single
maturity date have been included in the above table in the year of final contractual maturity. RMBS, CMBS and ABS are shown separately in the table,
as they are not due at a single maturity.
As discussed further in Note 2, an indemnification asset has been established in connection with certain investments acquired from American Life.
Evaluating Available-for-Sale Securities for Other-Than-Temporary Impairment
As described more fully in Note 1, the Company performs a regular evaluation, on a security-by-security basis, of its available-for-sale securities
holdings, including fixed maturity securities, equity securities and perpetual hybrid securities, in accordance with its impairment policy in order to evaluate
whether such investments are other-than-temporarily impaired.
MetLife, Inc. 119