MetLife 2011 Annual Report Download - page 28
Download and view the complete annual report
Please find page 28 of the 2011 MetLife annual report below. You can navigate through the pages in the report by either clicking on the pages listed below, or by using the keyword search tool below to find specific information within the annual report.-
 1
1 -
2
-
3
-
4
-
5
-
6
-
7
-
8
-
9
-
10
-
11
-
12
-
13
-
14
-
15
-
16
-
17
-
 18
18 -
 19
19 -
 20
20 -
 21
21 -
 22
22 -
 23
23 -
 24
24 -
 25
25 -
 26
26 -
 27
27 -
 28
28 -
 29
29 -
 30
30 -
 31
31 -
 32
32 -
 33
33 -
 34
34 -
 35
35 -
 36
36 -
 37
37 -
 38
38 -
39
-
40
-
41
-
42
-
43
-
44
-
45
-
46
-
47
-
48
-
49
-
50
-
51
-
52
-
53
-
54
-
55
-
56
-
57
-
58
-
59
-
60
-
61
-
62
-
63
-
64
-
65
-
66
-
67
-
68
-
69
-
70
-
71
-
72
-
73
-
74
-
75
-
76
-
77
-
78
-
79
-
80
-
81
-
82
-
83
-
84
-
85
-
86
-
87
-
88
-
89
-
90
-
91
-
92
-
93
-
94
-
95
-
96
-
97
-
98
-
99
-
100
-
101
-
102
-
103
-
104
-
105
-
106
-
107
-
108
-
109
-
110
-
111
-
112
-
113
-
114
-
115
-
116
-
117
-
118
-
119
-
120
-
121
-
122
-
123
-
124
-
125
-
126
-
127
-
128
-
129
-
130
-
131
-
132
-
133
-
134
-
135
-
136
-
137
-
138
-
139
-
140
-
141
-
142
-
143
-
144
-
145
-
146
-
147
-
148
-
149
-
150
-
151
-
152
-
153
-
154
-
155
-
156
-
157
-
158
-
159
-
160
-
161
-
162
-
163
-
164
-
165
-
166
-
167
-
168
-
169
-
170
-
171
-
172
-
173
-
174
-
175
-
176
-
177
-
178
-
179
-
180
-
181
-
182
-
183
-
184
-
185
-
186
-
187
-
188
-
189
-
190
-
191
-
192
-
193
-
194
-
195
-
196
-
197
-
198
-
199
-
200
-
201
-
202
-
203
-
204
-
205
-
206
-
207
-
208
-
209
-
210
-
211
-
212
-
213
-
214
-
215
-
216
-
217
-
218
-
219
-
220
-
221
-
222
-
223
-
224
-
225
-
226
-
227
-
228
-
229
-
230
-
231
-
232
-
233
-
234
-
235
-
236
-
237
-
238
-
239
-
240
-
241
-
242
-
243
 |
 |

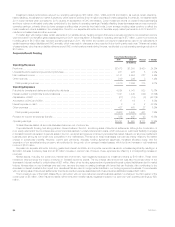
Investment market performance reduced our operating earnings by $56 million. DAC, VOBA and DSI amortization, as well as certain insurance-
related liabilities, are sensitive to market fluctuations, which was the primary driver of higher expenses in these categories. In particular, the less favorable
2011 equity markets when compared to 2010 caused an acceleration of DAC amortization. Lower investment returns on certain limited partnerships
and lower returns on allocated equity also contributed to the decline in operating earnings. Partially offsetting these decreases was an improvementin
operating earnings, primarily driven by lower average crediting rates on annuity fixed rate funds. Lower average crediting rates continue to reflect the
lower investment returns available in the marketplace. Growth in our separate accounts, due to favorable equity market performance in 2010 and 2011,
resulted in increased fees and other revenues.
To better align with hedged risks, certain elements of our variable annuity hedging program that were previously recorded in net investment income
were recorded in net derivative gains (losses) beginning in 2011 which resulted in a decrease in operating earnings of $77 million. Lower income annuity
mortality gains of $18 million also reduced operating earnings in 2011. We review and update our long-term assumptions used in our calculations of
certain insurance-related liabilities and DAC annually, which may result in changes and are recorded in the fourth quarter each year. This annual update
of assumptions, other insurance liability refinements and DAC model revisions made during the year, contributed to a net operating earnings reduction of
$12 million.
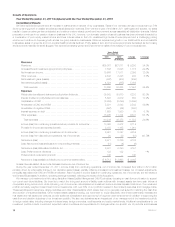
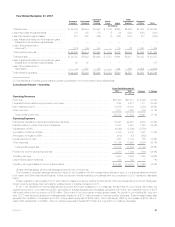
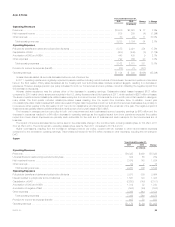
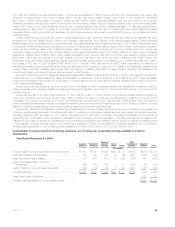
Corporate Benefit Funding
Years Ended December 31,
Change % Change2011 2010
(In millions)
Operating Revenues
Premiums .......................................................................... $2,418 $1,938 $ 480 24.8%
Universal life and investment-type product policy fees ........................................ 231 226 5 2.2%
Net investment income ............................................................... 5,181 4,954 227 4.6%
Other revenues ..................................................................... 249 246 3 1.2%
Total operating revenues ............................................................ 8,079 7,364 715 9.7%
Operating Expenses
Policyholder benefits and claims and policyholder dividends ................................... 4,594 4,041 553 13.7%
Interest credited to policyholder account balances .......................................... 1,321 1,445 (124) (8.6)%
Capitalization of DAC ................................................................. (27) (19) (8) (42.1)%
Amortization of DAC and VOBA ......................................................... 17 16 1 6.3%
Interest expense on debt .............................................................. 8 6 2 33.3%
Other expenses ..................................................................... 487 460 27 5.9%
Total operating expenses ............................................................ 6,400 5,949 451 7.6%
Provision for income tax expense (benefit) ................................................. 588 495 93 18.8%
Operating earnings ................................................................... $1,091 $ 920 $ 171 18.6%
Unless otherwise stated, all amounts discussed below are net of income tax.
Corporate Benefit Funding had strong pension closeout sales in the U.K., and strong sales of structured settlements. Although the combination of
poor equity returns and the low interest rate environment has resulted in underfunded pension plans, which reduces our customers’ flexibility to engage
in transactions such as pension closeouts, sales in the U.K. remained strong as we continue to penetrate that market. Sales in our structured settlement
business were strong as we remain very competitive in the marketplace. Premiums for these businesses were almost entirely offset by the related
change in policyholder benefits. However, current year premiums, deposits, funding agreement issuances, increased allocated equity, and the
expansion of our securities lending program, all contributed to the growth of our average invested assets, which led to an increase in net investment
income of $167 million.
Deposits into separate accounts, including guaranteed interest contracts, and corporate owned life insurance, increased significantly resultingina
$9 million increase in advisory fees and an $8 million increase in premium tax. However, these expenses are offset by a corresponding increase in
revenues.
Market factors, including the current low interest rate environment, have negatively impacted our investment returns by $19 million. These lower
investment returns include the impact of returns on invested economic capital. The low interest rate environment was also the primary driver of the
decrease in interest credited to policyholders of $81 million. Many of our funding agreement and guaranteed interest contract liabilities are tied to market
indices. Interest rates on new business were set lower, as were the rates on existing business with terms that can fluctuate. Also contributing to the
decrease in interest credited is the impact from derivatives that are used to hedge certain liabilities in our funding agreement business. Commensurate
with our strong sales of structured settlements, the interest credited expense associated with these insurance liabilities increased $26 million.
The Company’s use of the Death Master File in connection with our post-retirement benefit business resulted in a charge in the third quarter of the
current year of $8 million. Other insurance liability refinements and mortality results negatively impacted our year-over-year operating earnings by $20
million.
24 MetLife, Inc.