MetLife 2011 Annual Report Download - page 49
Download and view the complete annual report
Please find page 49 of the 2011 MetLife annual report below. You can navigate through the pages in the report by either clicking on the pages listed below, or by using the keyword search tool below to find specific information within the annual report.-
 1
1 -
2
-
3
-
4
-
5
-
6
-
7
-
8
-
9
-
10
-
11
-
12
-
13
-
14
-
15
-
16
-
17
-
18
-
19
-
20
-
21
-
22
-
23
-
24
-
25
-
26
-
27
-
28
-
29
-
30
-
31
-
32
-
33
-
34
-
35
-
36
-
37
-
38
-
 39
39 -
 40
40 -
 41
41 -
 42
42 -
 43
43 -
 44
44 -
 45
45 -
 46
46 -
 47
47 -
 48
48 -
 49
49 -
 50
50 -
 51
51 -
 52
52 -
 53
53 -
 54
54 -
 55
55 -
 56
56 -
 57
57 -
 58
58 -
 59
59 -
60
-
61
-
62
-
63
-
64
-
65
-
66
-
67
-
68
-
69
-
70
-
71
-
72
-
73
-
74
-
75
-
76
-
77
-
78
-
79
-
80
-
81
-
82
-
83
-
84
-
85
-
86
-
87
-
88
-
89
-
90
-
91
-
92
-
93
-
94
-
95
-
96
-
97
-
98
-
99
-
100
-
101
-
102
-
103
-
104
-
105
-
106
-
107
-
108
-
109
-
110
-
111
-
112
-
113
-
114
-
115
-
116
-
117
-
118
-
119
-
120
-
121
-
122
-
123
-
124
-
125
-
126
-
127
-
128
-
129
-
130
-
131
-
132
-
133
-
134
-
135
-
136
-
137
-
138
-
139
-
140
-
141
-
142
-
143
-
144
-
145
-
146
-
147
-
148
-
149
-
150
-
151
-
152
-
153
-
154
-
155
-
156
-
157
-
158
-
159
-
160
-
161
-
162
-
163
-
164
-
165
-
166
-
167
-
168
-
169
-
170
-
171
-
172
-
173
-
174
-
175
-
176
-
177
-
178
-
179
-
180
-
181
-
182
-
183
-
184
-
185
-
186
-
187
-
188
-
189
-
190
-
191
-
192
-
193
-
194
-
195
-
196
-
197
-
198
-
199
-
200
-
201
-
202
-
203
-
204
-
205
-
206
-
207
-
208
-
209
-
210
-
211
-
212
-
213
-
214
-
215
-
216
-
217
-
218
-
219
-
220
-
221
-
222
-
223
-
224
-
225
-
226
-
227
-
228
-
229
-
230
-
231
-
232
-
233
-
234
-
235
-
236
-
237
-
238
-
239
-
240
-
241
-
242
-
243
 |
 |

pricing sources that are market observable or can be derived principally from or corroborated by observable market data. See Note 5 of the Notes to the
Consolidated Financial Statements for a discussion of the types of market standard valuation methodologies utilized and key assumptions and
observable inputs used in applying these standard valuation methodologies. When a price is not available in the active market or through an
independent pricing service, management will value the security primarily using market standard internal matrix pricing or discounted cash flow
techniques, and non-binding quotations from independent brokers who are knowledgeable about these securities. Independent non-binding broker
quotations utilize inputs that may be difficult to corroborate with observable market data. As shown in the following section, less than 1% of our fixed
maturity securities were valued using non-binding quotations from independent brokers at December 31, 2011.
Senior management, independent of the trading and investing functions, is responsible for the oversight of control systems and valuation policies,
including reviewing and approving new transaction types and markets, for ensuring that observable market prices and market-based parameters are
used for valuation, wherever possible, and for determining that judgmental valuation adjustments, when applied, are based upon established policies
and are applied consistently over time. We review our valuation methodologies on an ongoing basis and revise when necessary based on changing
market conditions. We gain assurance on the overall reasonableness and consistent application of input assumptions, valuation methodologies and
compliance with accounting standards for fair value determination through our controls designed to ensure that the financial assets and financial liabilities
are appropriately valued and represent an exit price. We utilize several controls, including certain monthly controls, which include, but are not limited to,
analysis of portfolio returns to corresponding benchmark returns, comparing a sample of executed prices of securities sold to the fair value estimates,
comparing fair value estimates to management’s knowledge of the current market, reviewing the bid/ask spreads to assess activity, comparing prices
from multiple pricing sources, when available, reviewing independent auditor reports regarding the controls over valuation of securities employedby
independent pricing services, and ongoing due diligence to confirm that independent pricing services use market-based parameters for valuation. We
determine the observability of inputs used in estimated fair values received from independent pricing services or brokers by assessing whether these
inputs can be corroborated by observable market data.
The Company also applies a formal process to challenge any prices received from independent pricing services that are not considered
representative of estimated fair value. If we conclude that prices received from independent pricing services are not reflective of market activity or
representative of estimated fair value, we will seek independent non-binding broker quotes or use an internally developed valuation to override these
prices. As described below, such overrides have not been material. Our internally developed valuations of current estimated fair value, which reflect our
estimates of liquidity and non-performance risks, compared with pricing received from the independent pricing services, did not produce material
differences for the vast majority of our fixed maturity securities portfolio. This is, in part, because our internal estimates of liquidity and non-performance
risks are generally based on available market evidence and estimates used by other market participants. In the absence of such market-based
evidence, management’s best estimate is used. As a result, we generally use the price provided by the independent pricing service under our normal
pricing protocol.
The Company has reviewed the significance and observability of inputs used in the valuation methodologies to determine the appropriate fair value
hierarchy level for each of its securities. Based on the results of this review and investment class analyses, each instrument is categorized as Level 1, 2
or 3 based on the lowest level significant input to its valuation. Certain securities have been classified into Level 1 because of unadjusted quoted prices
and high volumes of trading activity and narrow bid/ask spreads. Most securities valued by independent pricing services have been classified into Level
2 because the significant inputs used in pricing these securities are market observable or can be corroborated using market observable information.
Most investment grade privately placed fixed maturity securities and certain below investment grade privately placed fixed maturity securities priced by
independent pricing services that use observable inputs have been classified within Level 2. Distressed privately placed fixed maturity securities have
been classified within Level 3. Below investment grade privately placed fixed maturity securities and less liquid securities with very limited trading activity
where estimated fair values are determined by independent pricing services or by non-binding quotations from independent brokers that use inputs that
may be difficult to corroborate with observable market data, are classified as Level 3. Use of independent non-binding broker quotations generally
indicates there is a lack of liquidity or the general lack of transparency in the process to develop these price estimates causing them to be considered
Level 3. See Note 5 of the Notes to the Consolidated Financial Statements for further information regarding the valuation techniques and inputs by level
within the three level fair value hierarchy by major classes of invested assets.
Quarterly, we evaluate and monitor the markets in which our fixed maturity and equity securities trade and, in our judgment, despite reduced levels of
liquidity discussed above, believe none of these fixed maturity and equity securities trading markets should be characterized as distressed and
disorderly.
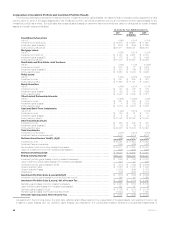
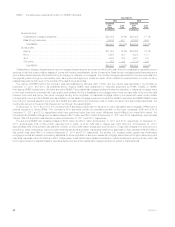
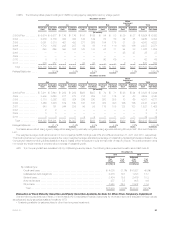
Fair Value Hierarchy and Level 3 Rollforward — Fixed Maturity and Equity Securities. Fixed maturity securities and equity securities available-for-sale
measured at estimated fair value on a recurring basis and their corresponding fair value pricing sources and fair value hierarchy are as follows:
December 31, 2011
Fixed Maturity
Securities Equity
Securities
(In millions)
Level 1:
Quoted prices in active markets for identical assets ............................................ $ 19,987 5.7% $ 819 27.1%
Level 2:
Independent pricing source .............................................................. 275,575 78.7 497 16.4
Internal matrix pricing or discounted cash flow techniques ....................................... 36,944 10.5 988 32.7
Significant other observable inputs ....................................................... 312,519 89.2 1,485 49.1
Level 3:
Independent pricing source .............................................................. 8,178 2.4 513 17.0
Internal matrix pricing or discounted cash flow techniques ....................................... 8,138 2.3 158 5.2
Independent broker quotations ............................................................ 1,449 0.4 48 1.6
Significant unobservable inputs ......................................................... 17,765 5.1 719 23.8
Total estimated fair value ............................................................. $350,271 100.0% $ 3,023 100.0%
MetLife, Inc. 45