MetLife 2011 Annual Report Download - page 143
Download and view the complete annual report
Please find page 143 of the 2011 MetLife annual report below. You can navigate through the pages in the report by either clicking on the pages listed below, or by using the keyword search tool below to find specific information within the annual report.-
 1
1 -
2
-
3
-
4
-
5
-
6
-
7
-
8
-
9
-
10
-
11
-
12
-
13
-
14
-
15
-
16
-
17
-
18
-
19
-
20
-
21
-
22
-
23
-
24
-
25
-
26
-
27
-
28
-
29
-
30
-
31
-
32
-
33
-
34
-
35
-
36
-
37
-
38
-
39
-
40
-
41
-
42
-
43
-
44
-
45
-
46
-
47
-
48
-
49
-
50
-
51
-
52
-
53
-
54
-
55
-
56
-
57
-
58
-
59
-
60
-
61
-
62
-
63
-
64
-
65
-
66
-
67
-
68
-
69
-
70
-
71
-
72
-
73
-
74
-
75
-
76
-
77
-
78
-
79
-
80
-
81
-
82
-
83
-
84
-
85
-
86
-
87
-
88
-
89
-
90
-
91
-
92
-
93
-
94
-
95
-
96
-
97
-
98
-
99
-
100
-
101
-
102
-
103
-
104
-
105
-
106
-
107
-
108
-
109
-
110
-
111
-
112
-
113
-
114
-
115
-
116
-
117
-
118
-
119
-
120
-
121
-
122
-
123
-
124
-
125
-
126
-
127
-
128
-
129
-
130
-
131
-
132
-
 133
133 -
 134
134 -
 135
135 -
 136
136 -
 137
137 -
 138
138 -
 139
139 -
 140
140 -
 141
141 -
 142
142 -
 143
143 -
 144
144 -
 145
145 -
 146
146 -
 147
147 -
 148
148 -
 149
149 -
 150
150 -
 151
151 -
 152
152 -
 153
153 -
154
-
155
-
156
-
157
-
158
-
159
-
160
-
161
-
162
-
163
-
164
-
165
-
166
-
167
-
168
-
169
-
170
-
171
-
172
-
173
-
174
-
175
-
176
-
177
-
178
-
179
-
180
-
181
-
182
-
183
-
184
-
185
-
186
-
187
-
188
-
189
-
190
-
191
-
192
-
193
-
194
-
195
-
196
-
197
-
198
-
199
-
200
-
201
-
202
-
203
-
204
-
205
-
206
-
207
-
208
-
209
-
210
-
211
-
212
-
213
-
214
-
215
-
216
-
217
-
218
-
219
-
220
-
221
-
222
-
223
-
224
-
225
-
226
-
227
-
228
-
229
-
230
-
231
-
232
-
233
-
234
-
235
-
236
-
237
-
238
-
239
-
240
-
241
-
242
-
243
 |
 |

MetLife, Inc.
Notes to the Consolidated Financial Statements — (Continued)
the issuer or investee. The maximum exposure to loss relating to mortgage loans is equal to the carrying amounts plus any unfunded commitments
of the Company. For certain of its investments in other invested assets, the Company’s return is in the form of income tax credits which are
guaranteed by a creditworthy third party. For such investments, the maximum exposure to loss is equal to the carrying amounts plus any unfunded
commitments, reduced by income tax credits guaranteed by third parties of $267 million and $231 million at December 31, 2011 and 2010,
respectively.
(2) For these variable interests, the Company’s involvement is limited to that of a passive investor.
As described in Note 16, the Company makes commitments to fund partnership investments in the normal course of business. Excluding these
commitments, the Company did not provide financial or other support to investees designated as VIEs during the years ended December 31, 2011,
2010 and 2009.
4. Derivative Financial Instruments
Accounting for Derivative Financial Instruments
See Note 1 for a description of the Company’s accounting policies for derivative financial instruments.
See Note 5 for information about the fair value hierarchy for derivatives.
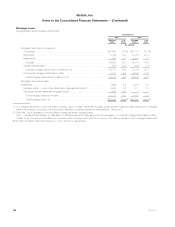
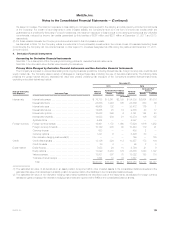
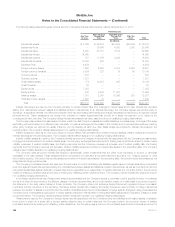
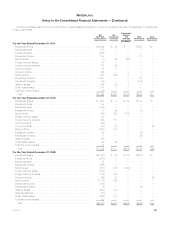
Primary Risks Managed by Derivative Financial Instruments and Non-Derivative Financial Instruments
The Company is exposed to various risks relating to its ongoing business operations, including interest rate risk, foreign currency risk, credit risk and
equity market risk. The Company uses a variety of strategies to manage these risks, including the use of derivative instruments. The following table
presents the gross notional amount, estimated fair value and primary underlying risk exposure of the Company’s derivative financial instruments,
excluding embedded derivatives, held at:
December 31,
2011 2010
Primary Underlying
Risk Exposure Instrument Type Notional
Amount
Estimated Fair Value(1) Notional
Amount
Estimated Fair
Value(1)
Assets Liabilities Assets Liabilities
(In millions)
Interest rate Interest rate swaps ................................ $ 79,733 $ 8,241 $2,199 $ 54,803 $2,654 $1,516
Interest rate floors ................................. 23,866 1,246 165 23,866 630 66
Interest rate caps .................................. 49,665 102 — 35,412 176 1
Interest rate futures ................................ 14,965 25 19 9,385 43 17
Interest rate options ................................ 16,988 896 6 8,761 144 23
Interest rate forwards ............................... 14,033 286 91 10,374 106 135
Synthetic GICs ................................... 4,454 — — 4,397 — —
Foreign currency Foreign currency swaps ............................ 16,461 1,172 1,060 17,626 1,616 1,282
Foreign currency forwards ........................... 10,149 200 60 10,443 119 91
Currency futures .................................. 633 — — 493 2 —
Currency options .................................. 1,321 6 — 5,426 50 —
Non-derivative hedging instruments(2) ................. — — — 169 — 185
Credit Credit default swaps ............................... 13,136 326 113 10,957 173 104
Credit forwards ................................... 20 4 — 90 2 3
Equity market Equity futures ..................................... 7,053 26 10 8,794 21 9
Equity options .................................... 17,099 3,263 179 33,688 1,843 1,197
Variance swaps ................................... 18,801 397 75 18,022 198 118
Total rate of return swaps ........................... 1,644 10 34 1,547 — —
Total ......................................... $290,021 $16,200 $4,011 $254,253 $7,777 $4,747
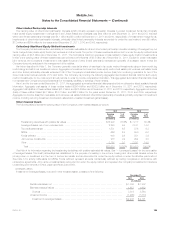
(1) The estimated fair value of all derivatives in an asset position is reported within other invested assets in the consolidated balance sheets and the
estimated fair value of all derivatives in a liability position is reported within other liabilities in the consolidated balance sheets.
(2) The estimated fair value of non-derivative hedging instruments represents the amortized cost of the instruments, as adjusted for foreign currency
transaction gains or losses. Non-derivative hedging instruments are reported within PABs in the consolidated balance sheets.
MetLife, Inc. 139