MetLife 2011 Annual Report Download - page 69
Download and view the complete annual report
Please find page 69 of the 2011 MetLife annual report below. You can navigate through the pages in the report by either clicking on the pages listed below, or by using the keyword search tool below to find specific information within the annual report.-
 1
1 -
2
-
3
-
4
-
5
-
6
-
7
-
8
-
9
-
10
-
11
-
12
-
13
-
14
-
15
-
16
-
17
-
18
-
19
-
20
-
21
-
22
-
23
-
24
-
25
-
26
-
27
-
28
-
29
-
30
-
31
-
32
-
33
-
34
-
35
-
36
-
37
-
38
-
39
-
40
-
41
-
42
-
43
-
44
-
45
-
46
-
47
-
48
-
49
-
50
-
51
-
52
-
53
-
54
-
55
-
56
-
57
-
58
-
 59
59 -
 60
60 -
 61
61 -
 62
62 -
 63
63 -
 64
64 -
 65
65 -
 66
66 -
 67
67 -
 68
68 -
 69
69 -
 70
70 -
 71
71 -
 72
72 -
 73
73 -
 74
74 -
 75
75 -
 76
76 -
 77
77 -
 78
78 -
 79
79 -
80
-
81
-
82
-
83
-
84
-
85
-
86
-
87
-
88
-
89
-
90
-
91
-
92
-
93
-
94
-
95
-
96
-
97
-
98
-
99
-
100
-
101
-
102
-
103
-
104
-
105
-
106
-
107
-
108
-
109
-
110
-
111
-
112
-
113
-
114
-
115
-
116
-
117
-
118
-
119
-
120
-
121
-
122
-
123
-
124
-
125
-
126
-
127
-
128
-
129
-
130
-
131
-
132
-
133
-
134
-
135
-
136
-
137
-
138
-
139
-
140
-
141
-
142
-
143
-
144
-
145
-
146
-
147
-
148
-
149
-
150
-
151
-
152
-
153
-
154
-
155
-
156
-
157
-
158
-
159
-
160
-
161
-
162
-
163
-
164
-
165
-
166
-
167
-
168
-
169
-
170
-
171
-
172
-
173
-
174
-
175
-
176
-
177
-
178
-
179
-
180
-
181
-
182
-
183
-
184
-
185
-
186
-
187
-
188
-
189
-
190
-
191
-
192
-
193
-
194
-
195
-
196
-
197
-
198
-
199
-
200
-
201
-
202
-
203
-
204
-
205
-
206
-
207
-
208
-
209
-
210
-
211
-
212
-
213
-
214
-
215
-
216
-
217
-
218
-
219
-
220
-
221
-
222
-
223
-
224
-
225
-
226
-
227
-
228
-
229
-
230
-
231
-
232
-
233
-
234
-
235
-
236
-
237
-
238
-
239
-
240
-
241
-
242
-
243
 |
 |

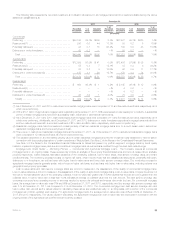
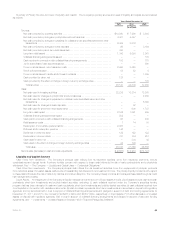
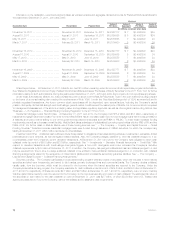
Summary of Primary Sources and Uses of Liquidity and Capital. The Company’s primary sources and uses of liquidity and capital are summarized
as follows:
Years Ended December 31,
2011 2010 2009
(In millions)
Sources:
Net cash provided by operating activities ........................................ $10,290 $ 7,996 $ 3,803
Net cash provided by changes in policyholder account balances ..................... 4,321 4,557 —
Net cash provided by changes in payables for collateral under securities loaned and other
transactions ............................................................. 6,444 3,076 —
Net cash provided by changes in bank deposits .................................. 96 — 3,164
Net cash provided by short-term debt issuances .................................. 380 — —
Long-term debt issued ...................................................... 1,346 5,090 2,961
Collateral financing arrangements issued ........................................ — — 105
Cash received in connection with collateral financing arrangements ................... 100 — 775
Junior subordinated debt securities issued ....................................... — — 500
Common stock issued, net of issuance costs .................................... 2,950 3,529 —
Stock options exercised ..................................................... 88 52 8
Common stock issued to settle stock forward contracts ............................ — — 1,035
Cash provided by other, net .................................................. 125 — —
Cash provided by the effect of change in foreign currency exchange rates .............. — — 108
Total sources ........................................................... 26,140 24,300 12,459
Uses:
Net cash used in investing activities ............................................ 22,235 18,314 13,935
Net cash used for changes in policyholder account balances ........................ — — 2,282
Net cash used for changes in payables for collateral under securities loaned and other
transactions ............................................................. — — 6,863
Net cash used for changes in bank deposits ..................................... — 32 —
Net cash used for short-term debt repayments ................................... — 606 1,747
Long-term debt repaid ...................................................... 2,042 1,061 555
Collateral financing arrangements repaid ........................................ 502 — —
Cash paid in connection with collateral financing arrangements ....................... 63 — 400
Debt issuance costs ........................................................ 1 14 30
Redemption of convertible preferred stock ....................................... 2,805 — —
Preferred stock redemption premium ........................................... 146 — —
Dividends on preferred stock ................................................. 122 122 122
Dividends on common stock ................................................. 787 784 610
Cash used in other, net ..................................................... — 304 42
Cash used in the effect of change in foreign currency exchange rates ................. 22 129 —
Total uses .............................................................. 28,725 21,366 26,586
Net increase (decrease) in cash and cash equivalents ................................ $(2,585) $ 2,934 $(14,127)
Liquidity and Capital Sources
Cash Flows from Operations. The Company’s principal cash inflows from its insurance activities come from insurance premiums, annuity
considerations and deposit funds. A primary liquidity concern with respect to these cash inflows is the risk of early contractholder and policyholder
withdrawal. See “— The Company — Liquidity and Capital Uses — Contractual Obligations.”
Cash Flows from Investments. The Company’s principal cash inflows from its investment activities come from repayments of principal, proceeds
from maturities, sales of invested assets, settlements of freestanding derivatives and net investment income. The primary liquidity concerns with respect
to these cash inflows are the risk of default by debtors and market disruption. The Company closely monitors and manages these risks through its credit
risk management process.
Liquid Assets. An integral part of the Company’s liquidity management is the amount of liquid assets it holds. Liquid assets include cash and cash
equivalents, short-term investments and publicly-traded securities, excluding: (i) cash collateral received under the Company’s securities lending
program that has been reinvested in cash and cash equivalents, short-term investments and publicly-traded securities; (ii) cash collateral received from
counterparties in connection with derivative instruments; (iii) cash and cash equivalents, short-term investments and securities on deposit with regulatory
agencies; and (iv) securities held in trust in support of collateral financing arrangements and pledged in support of debt and funding agreements. At
December 31, 2011 and 2010, the Company had $258.9 billion and $245.7 billion, respectively, in liquid assets. For further discussion of invested
assets on deposit with regulatory agencies, held in trust in support of collateral financing arrangements and pledged in support of debt and funding
agreements, see “ — Investments — Invested Assets on Deposit, Held in Trust and Pledged as Collateral.”
MetLife, Inc. 65