MetLife 2011 Annual Report Download - page 23
Download and view the complete annual report
Please find page 23 of the 2011 MetLife annual report below. You can navigate through the pages in the report by either clicking on the pages listed below, or by using the keyword search tool below to find specific information within the annual report.-
 1
1 -
2
-
3
-
4
-
5
-
6
-
7
-
8
-
9
-
10
-
11
-
12
-
 13
13 -
 14
14 -
 15
15 -
 16
16 -
 17
17 -
 18
18 -
 19
19 -
 20
20 -
 21
21 -
 22
22 -
 23
23 -
 24
24 -
 25
25 -
 26
26 -
 27
27 -
 28
28 -
 29
29 -
 30
30 -
 31
31 -
 32
32 -
 33
33 -
34
-
35
-
36
-
37
-
38
-
39
-
40
-
41
-
42
-
43
-
44
-
45
-
46
-
47
-
48
-
49
-
50
-
51
-
52
-
53
-
54
-
55
-
56
-
57
-
58
-
59
-
60
-
61
-
62
-
63
-
64
-
65
-
66
-
67
-
68
-
69
-
70
-
71
-
72
-
73
-
74
-
75
-
76
-
77
-
78
-
79
-
80
-
81
-
82
-
83
-
84
-
85
-
86
-
87
-
88
-
89
-
90
-
91
-
92
-
93
-
94
-
95
-
96
-
97
-
98
-
99
-
100
-
101
-
102
-
103
-
104
-
105
-
106
-
107
-
108
-
109
-
110
-
111
-
112
-
113
-
114
-
115
-
116
-
117
-
118
-
119
-
120
-
121
-
122
-
123
-
124
-
125
-
126
-
127
-
128
-
129
-
130
-
131
-
132
-
133
-
134
-
135
-
136
-
137
-
138
-
139
-
140
-
141
-
142
-
143
-
144
-
145
-
146
-
147
-
148
-
149
-
150
-
151
-
152
-
153
-
154
-
155
-
156
-
157
-
158
-
159
-
160
-
161
-
162
-
163
-
164
-
165
-
166
-
167
-
168
-
169
-
170
-
171
-
172
-
173
-
174
-
175
-
176
-
177
-
178
-
179
-
180
-
181
-
182
-
183
-
184
-
185
-
186
-
187
-
188
-
189
-
190
-
191
-
192
-
193
-
194
-
195
-
196
-
197
-
198
-
199
-
200
-
201
-
202
-
203
-
204
-
205
-
206
-
207
-
208
-
209
-
210
-
211
-
212
-
213
-
214
-
215
-
216
-
217
-
218
-
219
-
220
-
221
-
222
-
223
-
224
-
225
-
226
-
227
-
228
-
229
-
230
-
231
-
232
-
233
-
234
-
235
-
236
-
237
-
238
-
239
-
240
-
241
-
242
-
243
 |
 |
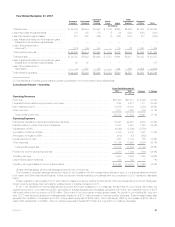
segments. In addition, the general account investment portfolio includes, within trading and other securities, contractholder-directed investments
supporting unit-linked variable annuity type liabilities, which do not qualify as separate account assets. The returns on these contractholder-directed
investments, which can vary significantly period to period, include changes in estimated fair value subsequent to purchase, inure to contractholders and
are offset in earnings by a corresponding change in policyholder account balances through interest credited to policyholder account balances.
The composition of the investment portfolio of each business segment is tailored to the specific characteristics of its insurance liabilities, causing
certain portfolios to be shorter in duration and others to be longer in duration. Accordingly, certain portfolios are more heavily weighted in longer duration,
higher yielding fixed maturity securities, or certain sub-sectors of fixed maturity securities, than other portfolios.
Investments are purchased to support our insurance liabilities and not to generate net investment gains and losses. However, net investment gains
and losses are incurred and can change significantly from period to period due to changes in external influences, including changes in market factors
such as interest rates, foreign currencies, credit spreads and equity markets; counterparty specific factors such as financial performance, credit rating
and collateral valuation; and internal factors such as portfolio rebalancing. Changes in these factors from period to period can significantly impact the
levels of both impairments and realized gains and losses on investments sold.
We use freestanding interest rate, equity, credit and currency derivatives to provide economic hedges of certain invested assets and insurance
liabilities, including embedded derivatives within certain of our variable annuity minimum benefit guarantees. For those hedges not designated as
accounting hedges, changes in market factors can lead to the recognition of fair value changes in net derivative gains (losses) without an offsetting gain
or loss recognized in earnings for the item being hedged even though these are effective economic hedges. Additionally, we issue liabilities and
purchase assets that contain embedded derivatives whose changes in estimated fair value are sensitive to changes in market factors and are also
recognized in net derivative gains (losses).
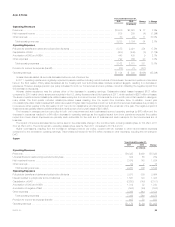
The favorable change in net derivative gains (losses) of $3.3 billion, from losses of $172 million in 2010 to gains of $3.1 billion in 2011, was driven
by a favorable change in freestanding derivatives of $3.9 billion, which was partially offset by an unfavorable change in embedded derivatives of $583
million primarily associated with variable annuity minimum benefit guarantees. The $3.9 billion favorable change in freestanding derivatives was primarily
attributable to the impact of falling long-term and mid-term interest rates and equity market movements and volatility. Long-term and mid-term interest
rates fell more in 2011 than in 2010 which had a positive impact of $2.1 billion on our interest rate derivatives, $670 million of which was attributable to
hedges of variable annuity minimum benefit guarantee liabilities that are accounted for as embedded derivatives. The impact of equity market
movements and volatility in 2011 compared to 2010 had a positive impact of $1.5 billion on our equity derivatives, which was primarily attributable to
hedges of variable annuity minimum benefit guarantee liabilities that are accounted for as embedded derivatives.
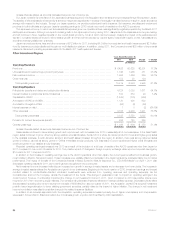
Certain variable annuity products with minimum benefit guarantees contain embedded derivatives that are measured at estimated fair value
separately from the host variable annuity contract with changes in estimated fair value recorded in net derivative gains (losses). The fair value of these
embedded derivatives also includes an adjustment for nonperformance risk, which is unhedged. The $583 million unfavorable change in embedded
derivatives was primarily attributable to hedged risks relating to changes in market factors of $1.6 billion and an unfavorable change in other unhedged
non-market risks of $308 million, partially offset by a favorable change in unhedged risks for changes in the adjustment for nonperformance risk of $1.3
billion. The aforementioned $1.6 billion unfavorable change in embedded derivatives was more than offset by favorable changes on freestanding
derivatives that hedge these risks, which are described in the preceding paragraphs.
The increase in net investment losses primarily reflects impairments on Greece sovereign debt securities, intent-to-sell impairments on other
sovereign debt securities due to the repositioning of the ALICO portfolio into longer duration and higher yielding investments, intent-to-sell impairments
related to the Divested Businesses, and lower net gains on sales of fixed maturity and equity securities. These losses were partially offset by net gains
on the sales of certain real estate investments and reductions in the mortgage valuation allowance reflecting improving real estate market fundamentals.
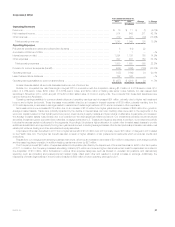
Income (loss) from continuing operations, net of income tax, related to the Divested Businesses, excluding net investment gains (losses) and net
derivative gains (losses), decreased $152 million to a loss of $41 million in 2011 compared to a gain of $111 million in 2010. Included in this loss was a
reduction in total revenues of $73 million and an increase in total expenses of $79 million. As previously mentioned, the Divested Businesses include
certain operations of MetLife Bank and the Caribbean Business.
Income tax expense for the year ended December 31, 2011 was $3.1 billion, or 31% of income (loss) from continuing operations before provision
for income tax, compared with $1.2 billion, or 30% of income (loss) from continuing operations before provision for income tax, for 2010. The
Company’s 2011 and 2010 effective tax rates differ from the U.S. statutory rate of 35% primarily due to the impact of certain permanent tax differences,
including non-taxable investment income and tax credits for investments in low income housing, in relation to income (loss) from continuing operations
before provision for income tax, as well as certain foreign permanent tax differences.
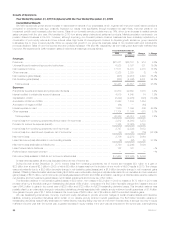
As more fully described in the discussion of performance measures above, we use operating earnings, which does not equate to income (loss) from
continuing operations, net of income tax, as determined in accordance with GAAP, to analyze our performance, evaluate segment performance, and
allocate resources. We believe that the presentation of operating earnings and operating earnings available to common shareholders, as we measure it
for management purposes, enhances the understanding of our performance by highlighting the results of operations and the underlying profitability
drivers of the business. Operating earnings and operating earnings available to common shareholders should not be viewed as substitutes for GAAP
income (loss) from continuing operations, net of income tax, and GAAP net income (loss) available to MetLife, Inc.’s common shareholders, respectively.
Operating earnings available to common shareholders increased $1.5 billion to $5.3 billion in 2011 from $3.8 billion in 2010.
MetLife, Inc. 19