MetLife 2011 Annual Report Download - page 47
Download and view the complete annual report
Please find page 47 of the 2011 MetLife annual report below. You can navigate through the pages in the report by either clicking on the pages listed below, or by using the keyword search tool below to find specific information within the annual report.-
 1
1 -
2
-
3
-
4
-
5
-
6
-
7
-
8
-
9
-
10
-
11
-
12
-
13
-
14
-
15
-
16
-
17
-
18
-
19
-
20
-
21
-
22
-
23
-
24
-
25
-
26
-
27
-
28
-
29
-
30
-
31
-
32
-
33
-
34
-
35
-
36
-
 37
37 -
 38
38 -
 39
39 -
 40
40 -
 41
41 -
 42
42 -
 43
43 -
 44
44 -
 45
45 -
 46
46 -
 47
47 -
 48
48 -
 49
49 -
 50
50 -
 51
51 -
 52
52 -
 53
53 -
 54
54 -
 55
55 -
 56
56 -
 57
57 -
58
-
59
-
60
-
61
-
62
-
63
-
64
-
65
-
66
-
67
-
68
-
69
-
70
-
71
-
72
-
73
-
74
-
75
-
76
-
77
-
78
-
79
-
80
-
81
-
82
-
83
-
84
-
85
-
86
-
87
-
88
-
89
-
90
-
91
-
92
-
93
-
94
-
95
-
96
-
97
-
98
-
99
-
100
-
101
-
102
-
103
-
104
-
105
-
106
-
107
-
108
-
109
-
110
-
111
-
112
-
113
-
114
-
115
-
116
-
117
-
118
-
119
-
120
-
121
-
122
-
123
-
124
-
125
-
126
-
127
-
128
-
129
-
130
-
131
-
132
-
133
-
134
-
135
-
136
-
137
-
138
-
139
-
140
-
141
-
142
-
143
-
144
-
145
-
146
-
147
-
148
-
149
-
150
-
151
-
152
-
153
-
154
-
155
-
156
-
157
-
158
-
159
-
160
-
161
-
162
-
163
-
164
-
165
-
166
-
167
-
168
-
169
-
170
-
171
-
172
-
173
-
174
-
175
-
176
-
177
-
178
-
179
-
180
-
181
-
182
-
183
-
184
-
185
-
186
-
187
-
188
-
189
-
190
-
191
-
192
-
193
-
194
-
195
-
196
-
197
-
198
-
199
-
200
-
201
-
202
-
203
-
204
-
205
-
206
-
207
-
208
-
209
-
210
-
211
-
212
-
213
-
214
-
215
-
216
-
217
-
218
-
219
-
220
-
221
-
222
-
223
-
224
-
225
-
226
-
227
-
228
-
229
-
230
-
231
-
232
-
233
-
234
-
235
-
236
-
237
-
238
-
239
-
240
-
241
-
242
-
243
 |
 |

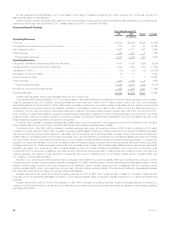
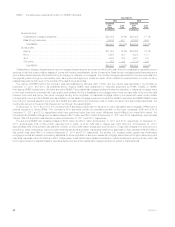
operations. This yield table presentation is consistent with how we measure our investment performance for management purposes, and we believe
it enhances understanding of our investment portfolio results.
(1) Yields are calculated as investment income as a percent of average quarterly asset carrying values. Investment income excludes recognized gains
and losses and reflects the operating revenue adjustments related to net investment income. Asset carrying values exclude unrealized investment
gains (losses), collateral received from counterparties associated with our securities lending program, freestanding derivative assets, collateral
received from derivative counterparties, the effects of consolidating under GAAP certain VIEs that are treated as consolidated securitization entities
(“CSEs”), contractholder-directed unit-linked investments and securitized reverse residential mortgage loans. A yield is not presented for other
invested assets, as it is not considered a meaningful measure of performance for this asset class.
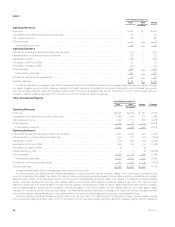
(2) Fixed maturity securities include $740 million, $594 million and $2.4 billion at estimated fair value of trading and other securities at December 31,
2011, 2010 and 2009, respectively. Fixed maturity securities include $31 million, $234 million and $400 million of investment income (loss) related
to trading and other securities for the years ended December 31, 2011, 2010 and 2009, respectively.
(3) As described in footnote (1) above, ending carrying values exclude contractholder-directed unit-linked investments — reported within trading and
other securities, securities held by CSEs — reported within trading and other securities, and securitized reverse residential mortgage loans– reported
within mortgage loans. The related adjustments to ending carrying value, investment income and investment gains (losses) by invested asset class
are presented below. The adjustments to investment income, net investment income and investment gains (losses) in the aggregate are as shown in
footnote (6) to this yield table. The adjustment to investment gains (losses) presented below and in footnote (6) to this yield table includes the effects
of remeasuring both the invested assets and long-term debt in accordance with the FVO.
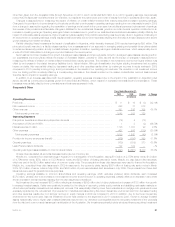
At or for the Year Ended December 31, 2011 At or for the Year Ended December 31, 2010
As Reported in the
Yield Table Excluded
Amounts Total As Reported in the
Yield Table Excluded
Amounts Total
(In millions) (In millions)
Trading and Other Securities:
(included within Fixed Maturity
Securities):
Ending carrying value ............. $ 740 $17,528 $ 18,268 $ 594 $17,995 $ 18,589
Investment income .............. $ 31 $ (444) $ (413) $ 234 $ 226 $ 460
Investment gains (losses) .......... $ (2) $ (8) $ (10) $ — $ (30) $ (30)
Mortgage Loans:
Ending carrying value ............. $ 61,303 $10,790 $ 72,093 $ 55,457 $ 6,840 $ 62,297
Investment income .............. $ 3,162 $ 332 $ 3,494 $ 2,821 $ 396 $ 3,217
Investment gains (losses) .......... $ 175 $ 13 $ 188 $ 22 $ 36 $ 58
Cash and Short-Term
Investments:
Ending carrying value ............. $ 27,750 $ 21 $ 27,771 $ 22,302 $ 39 $ 22,341
Total Investments:
Ending carrying value ............. $493,548 $28,339 $521,887 $448,389 $24,874 $473,263
(4) Investment income from fixed maturity securities and mortgage loans includes prepayment fees.
(5) For further information on Divested Businesses, see Note 2 of the Notes to the Consolidated Financial Statements. Prior period yields have been
recast to conform to the current period presentation to exclude from asset carrying values freestanding derivatives and collateral received from
derivative counterparties. Net investment income, investment portfolio gains (losses), and derivative gains (losses) are presented including and
excluding the impact of Divested Businesses. Yields are calculated including the net investment income and ending carrying values of the Divested
Businesses.
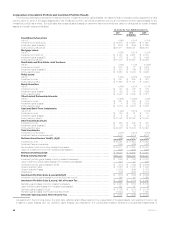
(6) Net investment income, investment portfolio gains (losses) and derivative gains (losses) presented in this yield table vary from the most directly
comparable measures presented in the GAAP consolidated statements of operations due to certain reclassifications affecting net investment
income, net investment gains (losses), net derivative gains (losses), interest credited to policyholder account balances, and other revenues, and
excludes the effects of consolidating under GAAP certain VIEs that are treated as CSEs. Such reclassifications are presented in the tables below.
Years Ended December 31,
2011 2010 2009
(In millions)
Net investment income — in the above yield table ................................... $20,011 $17,229 $15,007
Real estate discontinued operations — deduct from net investment income ............. (4) (2) (22)
Scheduled periodic settlement payments on derivatives not qualifying for hedge
accounting — deduct from net investment income, add to net derivative gains (losses) . . . (249) (208) (88)
Equity method operating joint ventures — add to net investment income, deduct from net
derivative gains (losses) .................................................... (23) (130) (156)
Net investment income on contractholder-directed unit-linked investments — reported within
trading and other securities — add to net investment income ....................... (453) 211 —
Incremental net investment income from CSEs — add to net investment income ......... 324 411 —
Net investment income — GAAP consolidated statements of operations .................. $19,606 $17,511 $14,741
MetLife, Inc. 43