MetLife 2011 Annual Report Download - page 65
Download and view the complete annual report
Please find page 65 of the 2011 MetLife annual report below. You can navigate through the pages in the report by either clicking on the pages listed below, or by using the keyword search tool below to find specific information within the annual report.-
 1
1 -
2
-
3
-
4
-
5
-
6
-
7
-
8
-
9
-
10
-
11
-
12
-
13
-
14
-
15
-
16
-
17
-
18
-
19
-
20
-
21
-
22
-
23
-
24
-
25
-
26
-
27
-
28
-
29
-
30
-
31
-
32
-
33
-
34
-
35
-
36
-
37
-
38
-
39
-
40
-
41
-
42
-
43
-
44
-
45
-
46
-
47
-
48
-
49
-
50
-
51
-
52
-
53
-
54
-
 55
55 -
 56
56 -
 57
57 -
 58
58 -
 59
59 -
 60
60 -
 61
61 -
 62
62 -
 63
63 -
 64
64 -
 65
65 -
 66
66 -
 67
67 -
 68
68 -
 69
69 -
 70
70 -
 71
71 -
 72
72 -
 73
73 -
 74
74 -
 75
75 -
76
-
77
-
78
-
79
-
80
-
81
-
82
-
83
-
84
-
85
-
86
-
87
-
88
-
89
-
90
-
91
-
92
-
93
-
94
-
95
-
96
-
97
-
98
-
99
-
100
-
101
-
102
-
103
-
104
-
105
-
106
-
107
-
108
-
109
-
110
-
111
-
112
-
113
-
114
-
115
-
116
-
117
-
118
-
119
-
120
-
121
-
122
-
123
-
124
-
125
-
126
-
127
-
128
-
129
-
130
-
131
-
132
-
133
-
134
-
135
-
136
-
137
-
138
-
139
-
140
-
141
-
142
-
143
-
144
-
145
-
146
-
147
-
148
-
149
-
150
-
151
-
152
-
153
-
154
-
155
-
156
-
157
-
158
-
159
-
160
-
161
-
162
-
163
-
164
-
165
-
166
-
167
-
168
-
169
-
170
-
171
-
172
-
173
-
174
-
175
-
176
-
177
-
178
-
179
-
180
-
181
-
182
-
183
-
184
-
185
-
186
-
187
-
188
-
189
-
190
-
191
-
192
-
193
-
194
-
195
-
196
-
197
-
198
-
199
-
200
-
201
-
202
-
203
-
204
-
205
-
206
-
207
-
208
-
209
-
210
-
211
-
212
-
213
-
214
-
215
-
216
-
217
-
218
-
219
-
220
-
221
-
222
-
223
-
224
-
225
-
226
-
227
-
228
-
229
-
230
-
231
-
232
-
233
-
234
-
235
-
236
-
237
-
238
-
239
-
240
-
241
-
242
-
243
 |
 |

Retirement Products. PABs are held for fixed deferred annuities and the fixed account portion of variable annuities, for certain income annuities,
and for certain portions of guaranteed benefits. PABs are credited interest at a rate set by the Company. Credited rates for deferred annuities are
influenced by current market rates, and most of these contracts have a minimum guaranteed rate between 1.0% and 4.0%. See “— Variable Annuity
Guarantees.”
Corporate Benefit Funding. PABs are comprised of funding agreements. Interest crediting rates vary by type of contract, and can be fixed or
variable. Variable interest crediting rates are generally tied to an external index, most commonly (1-month or 3-month) LIBOR. MetLife is exposed to
interest rate risks, and foreign exchange risk when guaranteeing payment of interest and return of principal at the contractual maturity date. The
Company may invest in floating rate assets, or enter into floating rate swaps, also tied to external indices, as well as caps to mitigate the impact of
changes in market interest rates. The Company also mitigates its risks by implementing an asset/liability matching policy and seeks to hedge all foreign
currency risk through the use of foreign currency hedges, including cross currency swaps.
Japan and Other International Regions. PABs are held largely for fixed income retirement and savings plans in Japan and Latin America and to a
lesser degree, amounts for unit-linked-type funds in certain countries across all regions that do not meet the GAAP definition of separate accounts. Also
included are certain liabilities for retirement and savings products sold in certain countries in Japan and Asia Pacific that generally are sold with minimum
credited rate guarantees. Liabilities for guarantees on certain variable annuities in Japan and Asia Pacific are established in accordance with derivatives
and hedging guidance and are also included within PABs. These liabilities are generally impacted by sustained periods of low interest rates, where there
are interest rate guarantees. The Company mitigates its risks by implementing an asset/liability matching policy and by hedging its variable annuity
guarantees. Liabilities for unit-linked-type funds are impacted by changes in the fair value of the associated underlying investments, as the returnon
assets is generally passed directly to the policyholder. See “— Variable Annuity Guarantees.”
Variable Annuity Guarantees
The Company issues, directly and through assumed reinsurance, certain variable annuity products with guaranteed minimum benefits that provide
the policyholder a minimum return based on their initial deposit (i.e., the benefit base) less withdrawals. See Notes 1 and 8 of the Notes to the
Consolidated Financial Statements for additional information.
The net amount at risk (“NAR”) for guarantees can change significantly during periods of sizable and sustained shifts in equity market performance,
increased equity volatility, or changes in interest rates. The NAR disclosed in Note 8 of the Notes to the Consolidated Financial Statements represents
management’s estimate of the current value of the benefits under these guarantees if they were all exercised simultaneously at December 31, 2011 and
2010, respectively. However, there are features, such as deferral periods and benefits requiring annuitization or death, that limit the amount of benefits
that will be payable in the near future.
Guarantees, including portions thereof, accounted for as embedded derivatives, are recorded at estimated fair value and included in PABs.
Guarantees accounted for as embedded derivatives include guaranteed minimum accumulation benefits, the non life-contingent portion of guaranteed
minimum withdrawal benefits (“GMWB”) and the portion of certain GMIB that do not require annuitization. For more detail on the determination of
estimated fair value, see Note 5 of the Notes to the Consolidated Financial Statements.
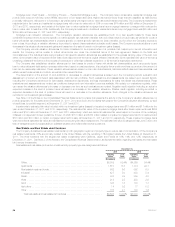
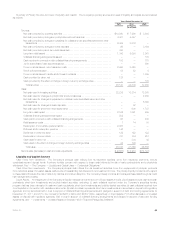
The table below contains the carrying value for guarantees included in PABs at:
December 31,
2011 2010
(In millions)
U.S. Business:
Guaranteed minimum accumulation benefit ..................................................... $ 52 $ 44
Guaranteed minimum withdrawal benefit ....................................................... 710 173
Guaranteed minimum income benefit .......................................................... 988 (51)
International:
Guaranteed minimum accumulation benefit ..................................................... 694 454
Guaranteed minimum withdrawal benefit ....................................................... 2,000 1,936
Total ................................................................................. $4,444 $2,556
Included in net derivative gains (losses) for the years ended December 31, 2011 and 2010 were gains (losses) of ($1.3) billion and ($269) million,
respectively, in embedded derivatives related to the change in estimated fair value of the guarantees. The carrying amount of guarantees accounted for
at estimated fair value includes an adjustment for nonperformance risk. In connection with this adjustment, gains (losses) of $1.8 billion and ($96) million
are included in the gains (losses) of ($1.3) billion and ($269) million in net derivative gains (losses) for the year ended December 31, 2011 and 2010,
respectively.
The estimated fair value of guarantees accounted for as embedded derivatives can change significantly during periods of sizable and sustained
shifts in equity market performance, equity volatility, interest rates or foreign exchange rates. Additionally, because the estimated fair value for guarantees
accounted for at estimated fair value includes an adjustment for nonperformance risk, a decrease in the Company’s credit spreads could cause the
value of these liabilities to increase. Conversely, a widening of the Company’s credit spreads could cause the value of these liabilities to decrease. The
Company uses derivative instruments and reinsurance to mitigate the liability exposure, risk of loss and the volatility of net income associated with these
liabilities. The derivative instruments used are primarily equity and treasury futures, equity options and variance swaps, and interest rate swaps. The
change in valuation arising from the nonperformance risk is not hedged.
MetLife, Inc. 61