MetLife 2011 Annual Report Download - page 19
Download and view the complete annual report
Please find page 19 of the 2011 MetLife annual report below. You can navigate through the pages in the report by either clicking on the pages listed below, or by using the keyword search tool below to find specific information within the annual report.-
 1
1 -
2
-
3
-
4
-
5
-
6
-
7
-
8
-
 9
9 -
 10
10 -
 11
11 -
 12
12 -
 13
13 -
 14
14 -
 15
15 -
 16
16 -
 17
17 -
 18
18 -
 19
19 -
 20
20 -
 21
21 -
 22
22 -
 23
23 -
 24
24 -
 25
25 -
 26
26 -
 27
27 -
 28
28 -
 29
29 -
30
-
31
-
32
-
33
-
34
-
35
-
36
-
37
-
38
-
39
-
40
-
41
-
42
-
43
-
44
-
45
-
46
-
47
-
48
-
49
-
50
-
51
-
52
-
53
-
54
-
55
-
56
-
57
-
58
-
59
-
60
-
61
-
62
-
63
-
64
-
65
-
66
-
67
-
68
-
69
-
70
-
71
-
72
-
73
-
74
-
75
-
76
-
77
-
78
-
79
-
80
-
81
-
82
-
83
-
84
-
85
-
86
-
87
-
88
-
89
-
90
-
91
-
92
-
93
-
94
-
95
-
96
-
97
-
98
-
99
-
100
-
101
-
102
-
103
-
104
-
105
-
106
-
107
-
108
-
109
-
110
-
111
-
112
-
113
-
114
-
115
-
116
-
117
-
118
-
119
-
120
-
121
-
122
-
123
-
124
-
125
-
126
-
127
-
128
-
129
-
130
-
131
-
132
-
133
-
134
-
135
-
136
-
137
-
138
-
139
-
140
-
141
-
142
-
143
-
144
-
145
-
146
-
147
-
148
-
149
-
150
-
151
-
152
-
153
-
154
-
155
-
156
-
157
-
158
-
159
-
160
-
161
-
162
-
163
-
164
-
165
-
166
-
167
-
168
-
169
-
170
-
171
-
172
-
173
-
174
-
175
-
176
-
177
-
178
-
179
-
180
-
181
-
182
-
183
-
184
-
185
-
186
-
187
-
188
-
189
-
190
-
191
-
192
-
193
-
194
-
195
-
196
-
197
-
198
-
199
-
200
-
201
-
202
-
203
-
204
-
205
-
206
-
207
-
208
-
209
-
210
-
211
-
212
-
213
-
214
-
215
-
216
-
217
-
218
-
219
-
220
-
221
-
222
-
223
-
224
-
225
-
226
-
227
-
228
-
229
-
230
-
231
-
232
-
233
-
234
-
235
-
236
-
237
-
238
-
239
-
240
-
241
-
242
-
243
 |
 |
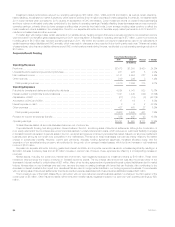
– The narrowing of the Company’s nonperformance risk adjustment increased the valuation of guarantee liabilities, decreased actual gross profits
and decreased DAC and VOBA amortization by $96 million. In addition, higher risk margins which increased the guarantee liability valuations,
decreased actual gross profits and decreased DAC and VOBA amortization by $18 million.
– The remainder of the impact of net investment gains (losses), which increased DAC amortization by $129 million, was primarily attributable to
current period investment activities.
‰Included in policyholder dividends and other was an increase in DAC and VOBA amortization of $42 million as a result of changes to long-term
assumptions. In addition, amortization increased by $39 million as a result of favorable gross margin variances. The remainder of the increase was
due to various immaterial items.
The following represents significant items contributing to the changes to DAC and VOBA amortization in 2009:
‰Changes in net investment gains (losses) resulted in the following changes in DAC and VOBA amortization:
– Actual gross profits increased as a result of a decrease in liabilities associated with guarantee obligations on variable annuities, resulting in an
increase of DAC and VOBA amortization of $995 million, excluding the impact from the Company’s nonperformance risk and risk margins,
which are described below. This increase in actual gross profits was partially offset by freestanding derivative losses associated with the
hedging of such guarantee obligations, which resulted in a decrease in DAC and VOBA amortization of $636 million.
– The narrowing of the Company’s nonperformance risk adjustment increased the valuation of guarantee liabilities, decreased actual gross profits
and decreased DAC and VOBA amortization by $607 million. This was partially offset by lower risk margins which decreased the guarantee
liability valuations, increased actual gross profits and increased DAC and VOBA amortization by $20 million.
– The remainder of the impact of net investment gains (losses), which decreased DAC amortization by $484 million, was primarily attributable to
current period investment activities.
‰Included in policyholder dividends and other was a decrease in DAC and VOBA amortization of $90 million as a result of changes to long-term
assumptions. The remainder of the decrease was due to various immaterial items.
The Company’s DAC and VOBA balance is also impacted by unrealized investment gains (losses) and the amount of amortization which would have
been recognized if such gains and losses had been realized. The increase in unrealized investment gains decreased the DAC and VOBA balance by
$879 million and $1.4 billion in 2011 and 2010, respectively. The decrease in unrealized investment losses decreased the DAC and VOBA balance by
$2.8 billion in 2009. Notes 3 and 6 of the Notes to the Consolidated Financial Statements include the DAC and VOBA offset to unrealized investment
losses.
Goodwill
Goodwill is tested for impairment at least annually or more frequently if events or circumstances, such as adverse changes in the business climate,
indicate that there may be justification for conducting an interim test.
For purposes of goodwill impairment testing, if the carrying value of a reporting unit exceeds its estimated fair value, the implied fair value of the
reporting unit goodwill is compared to the carrying value of that goodwill to measure the amount of impairment loss, if any. In such instances, the implied
fair value of the goodwill is determined in the same manner as the amount of goodwill that would be determined in a business acquisition. The key
inputs, judgments and assumptions necessary in determining estimated fair value of the reporting units include projected operating earnings, current
book value (with and without accumulated other comprehensive income), the level of economic capital required to support the mix of business, long-
term growth rates, comparative market multiples, the account value of in-force business, projections of new and renewal business, as well as margins
on such business, the level of interest rates, credit spreads, equity market levels, and the discount rate that we believe is appropriate for the respective
reporting unit. The estimated fair values of the retirement products and individual life reporting units are particularly sensitive to the equity market levels.
We apply significant judgment when determining the estimated fair value of our reporting units and when assessing the relationship of market
capitalization to the aggregate estimated fair value of our reporting units. The valuation methodologies utilized are subject to key judgments and
assumptions that are sensitive to change. Estimates of fair value are inherently uncertain and represent only management’s reasonable expectation
regarding future developments. These estimates and the judgments and assumptions upon which the estimates are based will, in all likelihood, differ in
some respects from actual future results. Declines in the estimated fair value of our reporting units could result in goodwill impairments in future periods
which could materially adversely affect our results of operations or financial position.
During the third quarter of 2011, the Company announced its decision to explore the sale of MetLife Bank’s depository business. As a result, in
September 2011, the Company performed a goodwill impairment test on MetLife Bank, which is a separate reporting unit within Corporate & Other. As
a result of the testing, the Company recorded a $65 million goodwill impairment charge that is reflected as a net investment loss for the year ended
December 31, 2011. See Note 7 of the Notes to the Consolidated Financial Statements.
In addition, the Company performed its annual goodwill impairment tests of its other reporting units and concluded that the fair values of all reporting
units were in excess of their carrying values and, therefore, goodwill was not impaired. On an ongoing basis, we evaluate potential triggering events that
may affect the estimated fair value of our reporting units to assess whether any goodwill impairment exists.
In the fourth quarter of 2011, the Company performed interim goodwill impairment testing on the Retirement Products reporting unit. This testing was
due to adverse market conditions, which caused both the equity markets and interest rates to decline. The fair value of the Retirement Products
reporting unit, which was calculated based on application of an actuarial valuation approach, exceeded the carrying value by approximately 10%. The
valuation methodology is subject to judgments and assumptions that are sensitive to change. If we had assumed that the discount rate was 100 basis
points higher than the discount rate, the fair value of the Retirement Products reporting unit would have exceeded the carrying value by approximately
2%. As of December 31, 2011, the amount of goodwill allocated to the Retirement Products reporting unit was approximately $1.7 billion. The estimate
of fair value is inherently uncertain and the judgments and assumptions upon which the estimate is based, will, in all likelihood, differ in some respects
from actual future results. A change in market conditions, including equity market returns, interest rate levels and market volatility could result in a
goodwill impairment.
In the fourth quarter of 2011, the Company announced that it will be reorganizing its business into three broad geographic regions, The Americas,
EMEA and Asia, and creating a global employee benefits business, to better reflect its global reach. As a result, the Company’s reporting structure may
change the composition of certain of its reporting units.
See Note 7 of the Notes to the Consolidated Financial Statements for additional information on the Company’s goodwill.
Liability for Future Policy Benefits
Generally, future policy benefits are payable over an extended period of time and related liabilities are calculated as the present value of future
expected benefits to be paid reduced by the present value of future expected premiums. Such liabilities are established based on methods and
MetLife, Inc. 15