MetLife 2011 Annual Report Download - page 122
Download and view the complete annual report
Please find page 122 of the 2011 MetLife annual report below. You can navigate through the pages in the report by either clicking on the pages listed below, or by using the keyword search tool below to find specific information within the annual report.-
 1
1 -
2
-
3
-
4
-
5
-
6
-
7
-
8
-
9
-
10
-
11
-
12
-
13
-
14
-
15
-
16
-
17
-
18
-
19
-
20
-
21
-
22
-
23
-
24
-
25
-
26
-
27
-
28
-
29
-
30
-
31
-
32
-
33
-
34
-
35
-
36
-
37
-
38
-
39
-
40
-
41
-
42
-
43
-
44
-
45
-
46
-
47
-
48
-
49
-
50
-
51
-
52
-
53
-
54
-
55
-
56
-
57
-
58
-
59
-
60
-
61
-
62
-
63
-
64
-
65
-
66
-
67
-
68
-
69
-
70
-
71
-
72
-
73
-
74
-
75
-
76
-
77
-
78
-
79
-
80
-
81
-
82
-
83
-
84
-
85
-
86
-
87
-
88
-
89
-
90
-
91
-
92
-
93
-
94
-
95
-
96
-
97
-
98
-
99
-
100
-
101
-
102
-
103
-
104
-
105
-
106
-
107
-
108
-
109
-
110
-
111
-
 112
112 -
 113
113 -
 114
114 -
 115
115 -
 116
116 -
 117
117 -
 118
118 -
 119
119 -
 120
120 -
 121
121 -
 122
122 -
 123
123 -
 124
124 -
 125
125 -
 126
126 -
 127
127 -
 128
128 -
 129
129 -
 130
130 -
 131
131 -
 132
132 -
133
-
134
-
135
-
136
-
137
-
138
-
139
-
140
-
141
-
142
-
143
-
144
-
145
-
146
-
147
-
148
-
149
-
150
-
151
-
152
-
153
-
154
-
155
-
156
-
157
-
158
-
159
-
160
-
161
-
162
-
163
-
164
-
165
-
166
-
167
-
168
-
169
-
170
-
171
-
172
-
173
-
174
-
175
-
176
-
177
-
178
-
179
-
180
-
181
-
182
-
183
-
184
-
185
-
186
-
187
-
188
-
189
-
190
-
191
-
192
-
193
-
194
-
195
-
196
-
197
-
198
-
199
-
200
-
201
-
202
-
203
-
204
-
205
-
206
-
207
-
208
-
209
-
210
-
211
-
212
-
213
-
214
-
215
-
216
-
217
-
218
-
219
-
220
-
221
-
222
-
223
-
224
-
225
-
226
-
227
-
228
-
229
-
230
-
231
-
232
-
233
-
234
-
235
-
236
-
237
-
238
-
239
-
240
-
241
-
242
-
243
 |
 |

MetLife, Inc.
Notes to the Consolidated Financial Statements — (Continued)
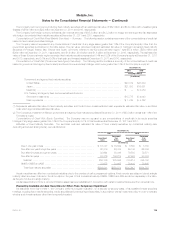
2009 Disposition through Assumption Reinsurance
On October 30, 2009, the Company completed the disposal, through assumption reinsurance, of substantially all of the insurance business of
MetLife Canada, a wholly-owned indirect subsidiary, to a third-party. Pursuant to the assumption reinsurance agreement, the consideration paid by the
Company was $259 million, comprised of cash of $14 million and fixed maturity securities, mortgage loans and other assets totaling $245 million. At the
date of the assumption reinsurance agreement, the carrying value of insurance liabilities transferred was $267 million, resulting in a gain of $5 million, net
of income tax. The gain was recognized in net investment gains (losses).
3. Investments
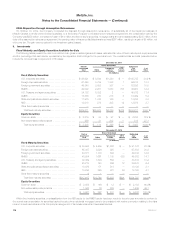
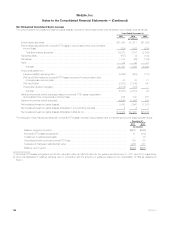
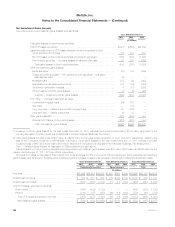
Fixed Maturity and Equity Securities Available-for-Sale
The following tables present the cost or amortized cost, gross unrealized gains and losses, estimated fair value of fixed maturity and equity securities
and the percentage that each sector represents by the respective total holdings for the periods shown. The unrealized loss amounts presented below
include the noncredit loss component of OTTI losses:
December 31, 2011
Cost or
Amortized
Cost
Gross Unrealized Estimated
Fair
Value %of
TotalGains Temporary
Losses OTTI
Losses
(In millions)
Fixed Maturity Securities:
U.S. corporate securities ........................ $ 98,621 $ 8,544 $1,380 $ — $105,785 30.2 %
Foreign corporate securities ...................... 61,568 3,789 1,338 1 64,018 18.3
Foreign government securities .................... 49,840 3,053 357 — 52,536 15.0
RMBS ....................................... 42,092 2,281 1,033 703 42,637 12.2
U.S. Treasury and agency securities ............... 34,132 5,882 2 — 40,012 11.4
CMBS ....................................... 18,565 730 218 8 19,069 5.4
State and political subdivision securities ............. 11,975 1,416 156 — 13,235 3.8
ABS......................................... 13,018 278 305 12 12,979 3.7
Other fixed maturity securities ..................... — — — — — —
Total fixed maturity securities .................... $329,811 $25,973 $4,789 $724 $350,271 100.0 %
Equity Securities:
Common stock ................................ $ 2,219 $ 83 $ 97 $ — $ 2,205 72.9 %
Non-redeemable preferred stock .................. 989 31 202 — 818 27.1
Total equity securities ......................... $ 3,208 $ 114 $ 299 $ — $ 3,023 100.0 %
December 31, 2010
Cost or
Amortized
Cost
Gross Unrealized Estimated
Fair
Value %of
TotalGains Temporary
Losses OTTI
Losses
(In millions)
Fixed Maturity Securities:
U.S. corporate securities ......................... $ 88,905 $ 4,469 $1,602 $ — $ 91,772 28.3%
Foreign corporate securities ....................... 65,487 3,326 925 — 67,888 20.9
Foreign government securities ..................... 40,871 1,733 602 — 42,002 12.9
RMBS ....................................... 45,904 1,661 1,180 533 45,852 14.1
U.S. Treasury and agency securities ................ 32,469 1,394 559 — 33,304 10.2
CMBS ....................................... 20,213 740 266 12 20,675 6.4
State and political subdivision securities ............. 10,476 171 518 — 10,129 3.1
ABS ......................................... 13,286 265 327 56 13,168 4.1
Other fixed maturity securities ..................... 6 1 — — 7 —
Total fixed maturity securities .................... $317,617 $13,760 $5,979 $601 $324,797 100.0%
Equity Securities:
Common stock ................................ $ 2,059 $ 146 $ 12 $ — $ 2,193 60.9%
Non-redeemable preferred stock ................... 1,562 76 229 — 1,409 39.1
Total equity securities .......................... $ 3,621 $ 222 $ 241 $ — $ 3,602 100.0%
Within fixed maturity securities, a reclassification from the ABS sector to the RMBS sector has been made to the prior year amounts to conform to
the current year presentation for securities backed by sub-prime residential mortgage loans to be consistent with market convention relating to the risks
inherent in such securities and the Company’s management of its investments within these asset sectors.
118 MetLife, Inc.