MetLife 2011 Annual Report Download - page 217
Download and view the complete annual report
Please find page 217 of the 2011 MetLife annual report below. You can navigate through the pages in the report by either clicking on the pages listed below, or by using the keyword search tool below to find specific information within the annual report.-
 1
1 -
2
-
3
-
4
-
5
-
6
-
7
-
8
-
9
-
10
-
11
-
12
-
13
-
14
-
15
-
16
-
17
-
18
-
19
-
20
-
21
-
22
-
23
-
24
-
25
-
26
-
27
-
28
-
29
-
30
-
31
-
32
-
33
-
34
-
35
-
36
-
37
-
38
-
39
-
40
-
41
-
42
-
43
-
44
-
45
-
46
-
47
-
48
-
49
-
50
-
51
-
52
-
53
-
54
-
55
-
56
-
57
-
58
-
59
-
60
-
61
-
62
-
63
-
64
-
65
-
66
-
67
-
68
-
69
-
70
-
71
-
72
-
73
-
74
-
75
-
76
-
77
-
78
-
79
-
80
-
81
-
82
-
83
-
84
-
85
-
86
-
87
-
88
-
89
-
90
-
91
-
92
-
93
-
94
-
95
-
96
-
97
-
98
-
99
-
100
-
101
-
102
-
103
-
104
-
105
-
106
-
107
-
108
-
109
-
110
-
111
-
112
-
113
-
114
-
115
-
116
-
117
-
118
-
119
-
120
-
121
-
122
-
123
-
124
-
125
-
126
-
127
-
128
-
129
-
130
-
131
-
132
-
133
-
134
-
135
-
136
-
137
-
138
-
139
-
140
-
141
-
142
-
143
-
144
-
145
-
146
-
147
-
148
-
149
-
150
-
151
-
152
-
153
-
154
-
155
-
156
-
157
-
158
-
159
-
160
-
161
-
162
-
163
-
164
-
165
-
166
-
167
-
168
-
169
-
170
-
171
-
172
-
173
-
174
-
175
-
176
-
177
-
178
-
179
-
180
-
181
-
182
-
183
-
184
-
185
-
186
-
187
-
188
-
189
-
190
-
191
-
192
-
193
-
194
-
195
-
196
-
197
-
198
-
199
-
200
-
201
-
202
-
203
-
204
-
205
-
206
-
 207
207 -
 208
208 -
 209
209 -
 210
210 -
 211
211 -
 212
212 -
 213
213 -
 214
214 -
 215
215 -
 216
216 -
 217
217 -
 218
218 -
 219
219 -
 220
220 -
 221
221 -
 222
222 -
 223
223 -
 224
224 -
 225
225 -
 226
226 -
 227
227 -
228
-
229
-
230
-
231
-
232
-
233
-
234
-
235
-
236
-
237
-
238
-
239
-
240
-
241
-
242
-
243
 |
 |

MetLife, Inc.
Notes to the Consolidated Financial Statements — (Continued)
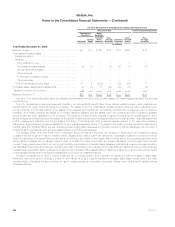
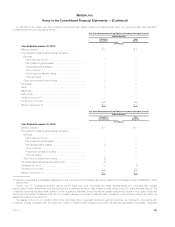
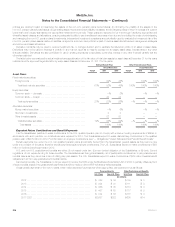
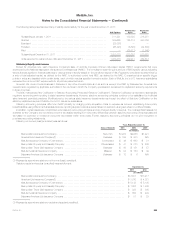
The table below summarizes the actual weighted average allocation of the fair value of total plan assets by asset class at December 31 for the years
indicated and the approved target range allocation by major asset class as of December 31, 2011 for the Invested Plans:
Defined Benefit Plan Postretirement Medical Postretirement Life
Target
Range
Actual Allocation Target
Range
Actual Allocation Target
Range
Actual Allocation
2011 2010 2011 2010 2011 2010
Asset Class:
Fixed maturity securities:
Corporate ....................................... 27% 24% 17% 9% —% —%
Federal agency ................................... 4 3 4 2 — —
Foreign bonds ................................... 3 3 2 3 — —
Municipals ...................................... 3 2 8 5 — —
U.S. government bonds ............................ 16 12 20 11 — —
Total fixed maturity securities ...................... 50%-80% 53% 44% 50%-100% 51% 30% 0% —% —%
Equity securities:
Common stock — domestic ........................ 20% 27% 30% 48% —% —%
Common stock — foreign .......................... 4 8 7 10 — —
Total equity securities ............................ 0%-40% 24% 35% 0%-50% 37% 58% 0% —% —%
Alternative securities:
Money market securities ............................ —% 5% 1% —% —% —%
Pass-through securities ............................ 6 5 11 10 — —
Derivatives ...................................... 1 — — — — —
Short-term investments ............................ 6 1 — 1 100 100
Other invested assets ............................. 9 8 — — — —
Other receivables ................................. 1 1 — 1 — —
Securities receivable .............................. — 1 — — — —
Total alternative securities ......................... 10%-20% 23% 21% 10%-20% 12% 12% 100% 100% 100%
Total assets ................................. 100% 100% 100% 100% 100% 100%
MetLife, Inc. 213