MetLife 2011 Annual Report Download - page 55
Download and view the complete annual report
Please find page 55 of the 2011 MetLife annual report below. You can navigate through the pages in the report by either clicking on the pages listed below, or by using the keyword search tool below to find specific information within the annual report.-
 1
1 -
2
-
3
-
4
-
5
-
6
-
7
-
8
-
9
-
10
-
11
-
12
-
13
-
14
-
15
-
16
-
17
-
18
-
19
-
20
-
21
-
22
-
23
-
24
-
25
-
26
-
27
-
28
-
29
-
30
-
31
-
32
-
33
-
34
-
35
-
36
-
37
-
38
-
39
-
40
-
41
-
42
-
43
-
44
-
 45
45 -
 46
46 -
 47
47 -
 48
48 -
 49
49 -
 50
50 -
 51
51 -
 52
52 -
 53
53 -
 54
54 -
 55
55 -
 56
56 -
 57
57 -
 58
58 -
 59
59 -
 60
60 -
 61
61 -
 62
62 -
 63
63 -
 64
64 -
 65
65 -
66
-
67
-
68
-
69
-
70
-
71
-
72
-
73
-
74
-
75
-
76
-
77
-
78
-
79
-
80
-
81
-
82
-
83
-
84
-
85
-
86
-
87
-
88
-
89
-
90
-
91
-
92
-
93
-
94
-
95
-
96
-
97
-
98
-
99
-
100
-
101
-
102
-
103
-
104
-
105
-
106
-
107
-
108
-
109
-
110
-
111
-
112
-
113
-
114
-
115
-
116
-
117
-
118
-
119
-
120
-
121
-
122
-
123
-
124
-
125
-
126
-
127
-
128
-
129
-
130
-
131
-
132
-
133
-
134
-
135
-
136
-
137
-
138
-
139
-
140
-
141
-
142
-
143
-
144
-
145
-
146
-
147
-
148
-
149
-
150
-
151
-
152
-
153
-
154
-
155
-
156
-
157
-
158
-
159
-
160
-
161
-
162
-
163
-
164
-
165
-
166
-
167
-
168
-
169
-
170
-
171
-
172
-
173
-
174
-
175
-
176
-
177
-
178
-
179
-
180
-
181
-
182
-
183
-
184
-
185
-
186
-
187
-
188
-
189
-
190
-
191
-
192
-
193
-
194
-
195
-
196
-
197
-
198
-
199
-
200
-
201
-
202
-
203
-
204
-
205
-
206
-
207
-
208
-
209
-
210
-
211
-
212
-
213
-
214
-
215
-
216
-
217
-
218
-
219
-
220
-
221
-
222
-
223
-
224
-
225
-
226
-
227
-
228
-
229
-
230
-
231
-
232
-
233
-
234
-
235
-
236
-
237
-
238
-
239
-
240
-
241
-
242
-
243
 |
 |

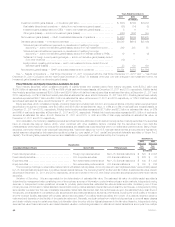
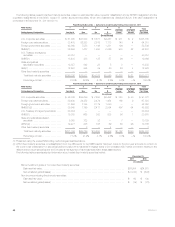
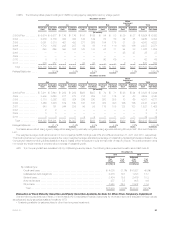
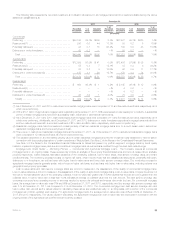
CMBS. The following tables present holdings of CMBS by rating agency designation and by vintage year at:
December 31, 2011
Aaa Aa A Baa
Below
Investment
Grade Total
Amortized
Cost Estimated
Fair Value Amortized
Cost Estimated
Fair Value Amortized
Cost Estimated
Fair Value Amortized
Cost Estimated
Fair Value Amortized
Cost Estimated
Fair Value Amortized
Cost Estimated
Fair Value
(In millions)
2003 & Prior ......... $ 5,574 $ 5,677 $ 176 $ 176 $ 91 $ 88 $ 54 $ 52 $ 29 $ 27 $ 5,924 $ 6,020
2004 ............... 3,586 3,730 430 440 135 129 83 80 32 25 4,266 4,404
2005 ............... 3,081 3,318 427 432 277 269 184 175 31 28 4,000 4,222
2006 ............... 1,712 1,835 245 237 89 83 118 110 123 106 2,287 2,371
2007 ............... 643 665 395 332 163 138 67 71 94 88 1,362 1,294
2008 ............... — — — — — — — — 25 27 25 27
2009 ............... — — — — — — — — — — — —
2010 ............... 3 3 — — — — 60 66 — — 63 69
2011 ............... 536 557 1 1 92 96 — — 9 8 638 662
Total ............. $15,135 $15,785 $1,674 $1,618 $847 $803 $ 566 $ 554 $343 $309 $18,565 $19,069
Ratings Distribution .... 82.8% 8.5% 4.2% 2.9% 1.6% 100.0%
December 31, 2010
Aaa Aa A Baa
Below
Investment
Grade Total
Amortized
Cost Estimated
Fair Value Amortized
Cost Estimated
Fair Value Amortized
Cost Estimated
Fair Value Amortized
Cost Estimated
Fair Value Amortized
Cost Estimated
Fair Value Amortized
Cost Estimated
Fair Value
(In millions)
2003 & Prior ......... $ 7,411 $ 7,640 $ 282 $ 282 $228 $227 $ 74 $ 71 $ 28 $ 24 $ 8,023 $ 8,244
2004 ............... 3,489 3,620 277 273 216 209 181 175 91 68 4,254 4,345
2005 ............... 3,113 3,292 322 324 286 280 263 255 73 66 4,057 4,217
2006 ............... 1,463 1,545 159 160 168 168 385 398 166 156 2,341 2,427
2007 ............... 840 791 344 298 96 95 119 108 122 133 1,521 1,425
2008 ............... 2 2 — — — — — — — — 2 2
2009 ............... 3 3 — — — — — — — — 3 3
2010 ............... 8 8 — — 4 4 — — — — 12 12
Total ............. $16,329 $16,901 $1,384 $1,337 $998 $983 $1,022 $1,007 $480 $447 $20,213 $20,675
Ratings Distribution .... 81.7% 6.4% 4.8% 4.9% 2.2% 100.0%
The tables above reflect rating agency designations assigned by nationally recognized rating agencies including Moody’s, S&P, Fitch and Realpoint,
LLC.
The weighted average credit enhancement of the Company’s CMBS holdings was 27% and 26% at December 31, 2011 and 2010, respectively.
This credit enhancement percentage represents the current weighted average estimated percentage of outstanding capital structure subordinated to the
Company’s investment holding that is available to absorb losses before the security incurs the first dollar of loss of principal. The credit protection does
not include any equity interest or property value in excess of outstanding debt.
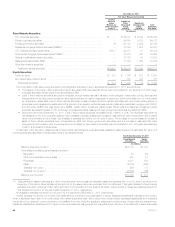
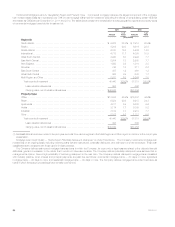
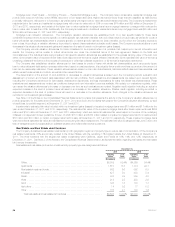
ABS. The Company’s ABS are diversified both by collateral type and by issuer. The following table presents information about ABS held at:
December 31,
2011 2010
Estimated
Fair
Value %of
Total
Estimated
Fair
Value %of
Total
(In millions) (In millions)
By collateral type:
Credit card loans ................................................... $ 4,038 31.1% $ 6,027 45.8%
Collateralized debt obligations ......................................... 2,575 19.8 1,798 13.7
Student loans ...................................................... 2,434 18.8 2,416 18.3
Automobile loans ................................................... 977 7.5 605 4.6
Other loans ....................................................... 2,955 22.8 2,322 17.6
Total ........................................................... $12,979 100.0% $13,168 100.0%
Evaluation of Fixed Maturity Securities and Equity Securities Available-for-Sale for Other-Than-Temporary Impairment
See the following sections within Note 3 of the Notes to the Consolidated Financial Statements for information about the evaluation of fixed maturity
securities and equity securities available-for-sale for OTTI:
‰Evaluating available-for-sale securities for other-than-temporary impairment;
MetLife, Inc. 51