MetLife 2011 Annual Report Download - page 147
Download and view the complete annual report
Please find page 147 of the 2011 MetLife annual report below. You can navigate through the pages in the report by either clicking on the pages listed below, or by using the keyword search tool below to find specific information within the annual report.-
 1
1 -
2
-
3
-
4
-
5
-
6
-
7
-
8
-
9
-
10
-
11
-
12
-
13
-
14
-
15
-
16
-
17
-
18
-
19
-
20
-
21
-
22
-
23
-
24
-
25
-
26
-
27
-
28
-
29
-
30
-
31
-
32
-
33
-
34
-
35
-
36
-
37
-
38
-
39
-
40
-
41
-
42
-
43
-
44
-
45
-
46
-
47
-
48
-
49
-
50
-
51
-
52
-
53
-
54
-
55
-
56
-
57
-
58
-
59
-
60
-
61
-
62
-
63
-
64
-
65
-
66
-
67
-
68
-
69
-
70
-
71
-
72
-
73
-
74
-
75
-
76
-
77
-
78
-
79
-
80
-
81
-
82
-
83
-
84
-
85
-
86
-
87
-
88
-
89
-
90
-
91
-
92
-
93
-
94
-
95
-
96
-
97
-
98
-
99
-
100
-
101
-
102
-
103
-
104
-
105
-
106
-
107
-
108
-
109
-
110
-
111
-
112
-
113
-
114
-
115
-
116
-
117
-
118
-
119
-
120
-
121
-
122
-
123
-
124
-
125
-
126
-
127
-
128
-
129
-
130
-
131
-
132
-
133
-
134
-
135
-
136
-
 137
137 -
 138
138 -
 139
139 -
 140
140 -
 141
141 -
 142
142 -
 143
143 -
 144
144 -
 145
145 -
 146
146 -
 147
147 -
 148
148 -
 149
149 -
 150
150 -
 151
151 -
 152
152 -
 153
153 -
 154
154 -
 155
155 -
 156
156 -
 157
157 -
158
-
159
-
160
-
161
-
162
-
163
-
164
-
165
-
166
-
167
-
168
-
169
-
170
-
171
-
172
-
173
-
174
-
175
-
176
-
177
-
178
-
179
-
180
-
181
-
182
-
183
-
184
-
185
-
186
-
187
-
188
-
189
-
190
-
191
-
192
-
193
-
194
-
195
-
196
-
197
-
198
-
199
-
200
-
201
-
202
-
203
-
204
-
205
-
206
-
207
-
208
-
209
-
210
-
211
-
212
-
213
-
214
-
215
-
216
-
217
-
218
-
219
-
220
-
221
-
222
-
223
-
224
-
225
-
226
-
227
-
228
-
229
-
230
-
231
-
232
-
233
-
234
-
235
-
236
-
237
-
238
-
239
-
240
-
241
-
242
-
243
 |
 |

MetLife, Inc.
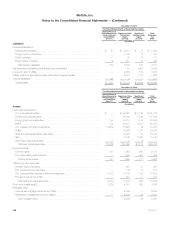
Notes to the Consolidated Financial Statements — (Continued)
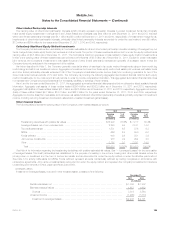
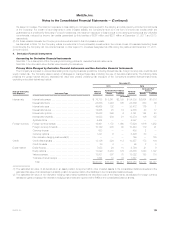
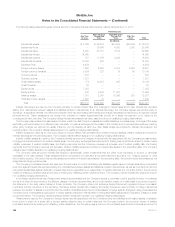
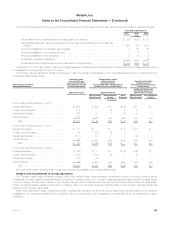
The following table presents the gross notional amount and estimated fair value of derivatives that were not designated or do not qualify as hedging
instruments by derivative type at:
December 31,
2011 2010
Derivatives Not Designated or Not
Qualifying as Hedging Instruments
Estimated
Fair
Value
Estimated
Fair
Value
Notional
Amount Assets Liabilities Notional
Amount Assets Liabilities
(In millions)
Interest rate swaps ............................ $ 71,923 $ 5,410 $2,107 $ 46,133 $1,729 $1,231
Interest rate floors ............................. 23,866 1,246 165 23,866 630 66
Interest rate caps ............................. 49,665 102 — 35,412 176 1
Interest rate futures ............................ 14,965 25 19 9,385 43 17
Interest rate options ........................... 16,988 896 6 8,761 144 23
Interest rate forwards .......................... 13,068 76 91 9,234 106 28
Synthetic GICs ............................... 4,454 — — 4,397 — —
Foreign currency swaps ........................ 6,871 320 656 7,546 496 790
Foreign currency forwards ...................... 6,630 145 38 8,508 110 65
Currency futures .............................. 633 — — 493 2 —
Currency options ............................. 1,321 6 — 5,426 50 —
Credit default swaps ........................... 13,136 326 113 10,957 173 104
Equity futures ................................ 7,053 26 10 8,794 21 9
Equity options ................................ 17,099 3,263 179 33,688 1,843 1,197
Variance swaps .............................. 18,801 397 75 18,022 198 118
Total rate of return swaps ....................... 1,644 10 34 1,547 — —
Total non-designated or non-qualifying
derivatives ............................... $268,117 $12,248 $3,493 $232,169 $5,721 $3,649
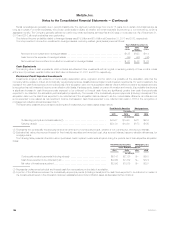
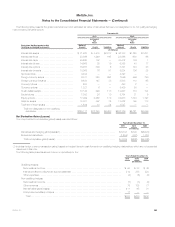
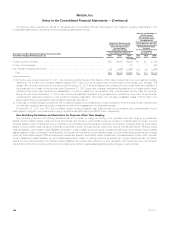
Net Derivative Gains (Losses)
The components of net derivative gains (losses) were as follows:
Years Ended December 31,
2011 2010 2009
(In millions)
Derivatives and hedging gains (losses)(1) .............................................. $6,108 $ 122 $(6,624)
Embedded derivatives ............................................................ (1,284) (387) 1,758
Total net derivative gains (losses) .................................................. $4,824 $(265) $(4,866)
(1) Includes foreign currency transaction gains (losses) on hedged items in cash flow and non-qualifying hedging relationships, which are not presented
elsewhere in this note.
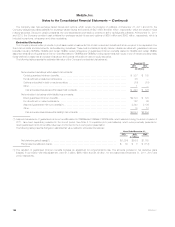
The following table presents earned income on derivatives for the:
Years Ended December 31,
2011 2010 2009
(In millions)
Qualifying hedges:
Net investment income .............................................................. $ 98 $ 83 $ 49
Interest credited to policyholder account balances ......................................... 214 233 220
Other expenses .................................................................... (4) (6) (3)
Non-qualifying hedges:
Net investment income .............................................................. (8) (3) (2)
Other revenues .................................................................... 75 108 77
Net derivative gains (losses) .......................................................... 411 65 91
Policyholder benefits and claims ....................................................... 17 — —
Total ........................................................................... $803 $480 $432
MetLife, Inc. 143