MetLife 2011 Annual Report Download - page 164
Download and view the complete annual report
Please find page 164 of the 2011 MetLife annual report below. You can navigate through the pages in the report by either clicking on the pages listed below, or by using the keyword search tool below to find specific information within the annual report.-
 1
1 -
2
-
3
-
4
-
5
-
6
-
7
-
8
-
9
-
10
-
11
-
12
-
13
-
14
-
15
-
16
-
17
-
18
-
19
-
20
-
21
-
22
-
23
-
24
-
25
-
26
-
27
-
28
-
29
-
30
-
31
-
32
-
33
-
34
-
35
-
36
-
37
-
38
-
39
-
40
-
41
-
42
-
43
-
44
-
45
-
46
-
47
-
48
-
49
-
50
-
51
-
52
-
53
-
54
-
55
-
56
-
57
-
58
-
59
-
60
-
61
-
62
-
63
-
64
-
65
-
66
-
67
-
68
-
69
-
70
-
71
-
72
-
73
-
74
-
75
-
76
-
77
-
78
-
79
-
80
-
81
-
82
-
83
-
84
-
85
-
86
-
87
-
88
-
89
-
90
-
91
-
92
-
93
-
94
-
95
-
96
-
97
-
98
-
99
-
100
-
101
-
102
-
103
-
104
-
105
-
106
-
107
-
108
-
109
-
110
-
111
-
112
-
113
-
114
-
115
-
116
-
117
-
118
-
119
-
120
-
121
-
122
-
123
-
124
-
125
-
126
-
127
-
128
-
129
-
130
-
131
-
132
-
133
-
134
-
135
-
136
-
137
-
138
-
139
-
140
-
141
-
142
-
143
-
144
-
145
-
146
-
147
-
148
-
149
-
150
-
151
-
152
-
153
-
 154
154 -
 155
155 -
 156
156 -
 157
157 -
 158
158 -
 159
159 -
 160
160 -
 161
161 -
 162
162 -
 163
163 -
 164
164 -
 165
165 -
 166
166 -
 167
167 -
 168
168 -
 169
169 -
 170
170 -
 171
171 -
 172
172 -
 173
173 -
 174
174 -
175
-
176
-
177
-
178
-
179
-
180
-
181
-
182
-
183
-
184
-
185
-
186
-
187
-
188
-
189
-
190
-
191
-
192
-
193
-
194
-
195
-
196
-
197
-
198
-
199
-
200
-
201
-
202
-
203
-
204
-
205
-
206
-
207
-
208
-
209
-
210
-
211
-
212
-
213
-
214
-
215
-
216
-
217
-
218
-
219
-
220
-
221
-
222
-
223
-
224
-
225
-
226
-
227
-
228
-
229
-
230
-
231
-
232
-
233
-
234
-
235
-
236
-
237
-
238
-
239
-
240
-
241
-
242
-
243
 |
 |

MetLife, Inc.
Notes to the Consolidated Financial Statements — (Continued)
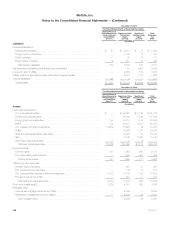
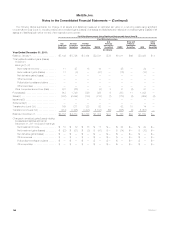
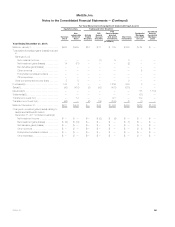
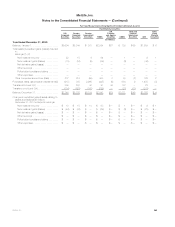
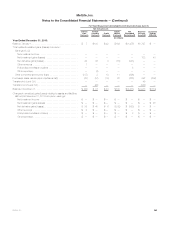
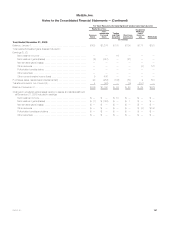
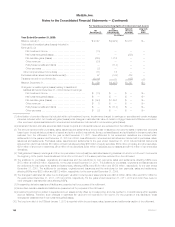
The following tables summarize the change of all assets and (liabilities) measured at estimated fair value on a recurring basis using significant
unobservable inputs (Level 3), including realized and unrealized gains (losses) of all assets and (liabilities) and realized and unrealized gains (losses) of all
assets and (liabilities) still held at the end of the respective time periods:
Fair Value Measurements Using Significant Unobservable Inputs (Level 3)
Fixed Maturity Securities:
U.S.
Corporate
Securities
Foreign
Corporate
Securities
Foreign
Government
Securities RMBS
U.S.
Treasury
and Agency
Securities CMBS
State and
Political
Subdivision
Securities ABS
Other
Fixed
Maturity
Securities
(In millions)
Year Ended December 31, 2011:
Balance, January 1, ................... $7,149 $ 5,726 $ 3,134 $ 2,541 $ 79 $1,011 $46 $ 3,026 $ 4
Total realized/unrealized gains (losses)
included in:
Earnings:(1), (2)
Net investment income ............. 11 27 18 10 — 25 — 24 —
Net investment gains (losses) ........ 17 (9) — (41) — (16) — (18) —
Net derivative gains (losses) ......... — — — — — — — — —
Other revenues ................... — — — — — — — — —
Policyholder benefits and claims ...... — — — — — — — — —
Other expenses .................. — — — — — — — — —
Other comprehensive income (loss) ..... 327 (66) — (5) 3 71 (8) 81 —
Purchases(3) ........................ 912 1,740 529 393 6 283 11 1,033 —
Sales(3) ............................ (887) (2,094) (179) (213) (1) (178) (4) (659) (4)
Issuances(3) ......................... — — — — — — — — —
Settlements(3) ....................... — — — — — — — — —
Transfers into Level 3(4) ................ 169 211 123 20 — 52 10 14 —
Transfers out of Level 3(4) .............. (914) (1,165) (1,303) (1,103) (56) (495) (2) (1,651) —
Balance, December 31, ................ $6,784 $ 4,370 $ 2,322 $ 1,602 $ 31 $ 753 $53 $ 1,850 $—
Changes in unrealized gains (losses) relating
to assets and liabilities still held at
December 31, 2011 included in earnings:
Net investment income ............. $ 10 $ 19 $ 18 $ 11 $— $ 24 $— $ 20 $—
Net investment gains (losses) ........ $ (27) $ (31) $ (3) $ (41) $ — $ (14) $ — $ (10) $—
Net derivative gains (losses) ......... $ — $ — $ — $ — $ — $ — $— $ — $—
Other revenues ................... $ — $ — $ — $ — $ — $ — $— $ — $—
Policyholder benefits and claims ...... $ — $ — $ — $ — $— $ — $— $ — $—
Other expenses .................. $ — $ — $ — $ — $— $ — $— $ — $—
160 MetLife, Inc.