MetLife 2011 Annual Report Download - page 84
Download and view the complete annual report
Please find page 84 of the 2011 MetLife annual report below. You can navigate through the pages in the report by either clicking on the pages listed below, or by using the keyword search tool below to find specific information within the annual report.-
 1
1 -
2
-
3
-
4
-
5
-
6
-
7
-
8
-
9
-
10
-
11
-
12
-
13
-
14
-
15
-
16
-
17
-
18
-
19
-
20
-
21
-
22
-
23
-
24
-
25
-
26
-
27
-
28
-
29
-
30
-
31
-
32
-
33
-
34
-
35
-
36
-
37
-
38
-
39
-
40
-
41
-
42
-
43
-
44
-
45
-
46
-
47
-
48
-
49
-
50
-
51
-
52
-
53
-
54
-
55
-
56
-
57
-
58
-
59
-
60
-
61
-
62
-
63
-
64
-
65
-
66
-
67
-
68
-
69
-
70
-
71
-
72
-
73
-
 74
74 -
 75
75 -
 76
76 -
 77
77 -
 78
78 -
 79
79 -
 80
80 -
 81
81 -
 82
82 -
 83
83 -
 84
84 -
 85
85 -
 86
86 -
 87
87 -
 88
88 -
 89
89 -
 90
90 -
 91
91 -
 92
92 -
 93
93 -
 94
94 -
95
-
96
-
97
-
98
-
99
-
100
-
101
-
102
-
103
-
104
-
105
-
106
-
107
-
108
-
109
-
110
-
111
-
112
-
113
-
114
-
115
-
116
-
117
-
118
-
119
-
120
-
121
-
122
-
123
-
124
-
125
-
126
-
127
-
128
-
129
-
130
-
131
-
132
-
133
-
134
-
135
-
136
-
137
-
138
-
139
-
140
-
141
-
142
-
143
-
144
-
145
-
146
-
147
-
148
-
149
-
150
-
151
-
152
-
153
-
154
-
155
-
156
-
157
-
158
-
159
-
160
-
161
-
162
-
163
-
164
-
165
-
166
-
167
-
168
-
169
-
170
-
171
-
172
-
173
-
174
-
175
-
176
-
177
-
178
-
179
-
180
-
181
-
182
-
183
-
184
-
185
-
186
-
187
-
188
-
189
-
190
-
191
-
192
-
193
-
194
-
195
-
196
-
197
-
198
-
199
-
200
-
201
-
202
-
203
-
204
-
205
-
206
-
207
-
208
-
209
-
210
-
211
-
212
-
213
-
214
-
215
-
216
-
217
-
218
-
219
-
220
-
221
-
222
-
223
-
224
-
225
-
226
-
227
-
228
-
229
-
230
-
231
-
232
-
233
-
234
-
235
-
236
-
237
-
238
-
239
-
240
-
241
-
242
-
243
 |
 |

(interest rate, equity market and foreign currency exchange rate) relating to its trading and non trading assets and liabilities. The Company modeled the
impact of changes in market rates and prices on the estimated fair values of its market sensitive assets and liabilities as follows:
‰the net present values of its interest rate sensitive exposures resulting from a 10% change (increase or decrease) in interest rates;
‰the U.S. dollar equivalent estimated fair values of the Company’s foreign currency exposures due to a 10% change (increase or decrease) in
foreign currency exchange rates; and
‰the estimated fair value of its equity positions due to a 10% change (increase or decrease) in equity market prices.
The sensitivity analysis is an estimate and should not be viewed as predictive of the Company’s future financial performance. The Company cannot
ensure that its actual losses in any particular period will not exceed the amounts indicated in the table below. Limitations related to this sensitivity
analysis include:
‰the market risk information is limited by the assumptions and parameters established in creating the related sensitivity analysis, including the
impact of prepayment rates on mortgages;
‰for the derivatives that qualify as hedges, the impact on reported earnings may be materially different from the change in market values;
‰the analysis excludes other significant real estate holdings and liabilities pursuant to insurance contracts; and
‰the model assumes that the composition of assets and liabilities remains unchanged throughout the period.
Accordingly, the Company uses such models as tools and not as substitutes for the experience and judgment of its management. Based on its
analysis of the impact of a 10% change (increase or decrease) in market rates and prices, MetLife has determined that such a change could have a
material adverse effect on the estimated fair value of certain assets and liabilities from interest rate, foreign currency exchange rate and equity
exposures.
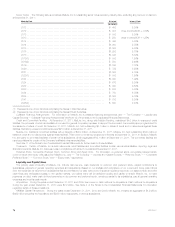
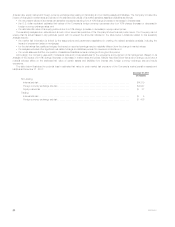
The table below illustrates the potential loss in estimated fair value for each market risk exposure of the Company’s market sensitive assets and
liabilities at December 31, 2011:
December 31, 2011
(In millions)
Non-trading:
Interest rate risk ........................................................................... $4,319
Foreign currency exchange rate risk ........................................................... $4,547
Equity market risk ......................................................................... $ 37
Trading:
Interest rate risk ........................................................................... $ 5
Foreign currency exchange rate risk ........................................................... $ 486
80 MetLife, Inc.