MetLife 2011 Annual Report Download - page 52
Download and view the complete annual report
Please find page 52 of the 2011 MetLife annual report below. You can navigate through the pages in the report by either clicking on the pages listed below, or by using the keyword search tool below to find specific information within the annual report.-
 1
1 -
2
-
3
-
4
-
5
-
6
-
7
-
8
-
9
-
10
-
11
-
12
-
13
-
14
-
15
-
16
-
17
-
18
-
19
-
20
-
21
-
22
-
23
-
24
-
25
-
26
-
27
-
28
-
29
-
30
-
31
-
32
-
33
-
34
-
35
-
36
-
37
-
38
-
39
-
40
-
41
-
 42
42 -
 43
43 -
 44
44 -
 45
45 -
 46
46 -
 47
47 -
 48
48 -
 49
49 -
 50
50 -
 51
51 -
 52
52 -
 53
53 -
 54
54 -
 55
55 -
 56
56 -
 57
57 -
 58
58 -
 59
59 -
 60
60 -
 61
61 -
 62
62 -
63
-
64
-
65
-
66
-
67
-
68
-
69
-
70
-
71
-
72
-
73
-
74
-
75
-
76
-
77
-
78
-
79
-
80
-
81
-
82
-
83
-
84
-
85
-
86
-
87
-
88
-
89
-
90
-
91
-
92
-
93
-
94
-
95
-
96
-
97
-
98
-
99
-
100
-
101
-
102
-
103
-
104
-
105
-
106
-
107
-
108
-
109
-
110
-
111
-
112
-
113
-
114
-
115
-
116
-
117
-
118
-
119
-
120
-
121
-
122
-
123
-
124
-
125
-
126
-
127
-
128
-
129
-
130
-
131
-
132
-
133
-
134
-
135
-
136
-
137
-
138
-
139
-
140
-
141
-
142
-
143
-
144
-
145
-
146
-
147
-
148
-
149
-
150
-
151
-
152
-
153
-
154
-
155
-
156
-
157
-
158
-
159
-
160
-
161
-
162
-
163
-
164
-
165
-
166
-
167
-
168
-
169
-
170
-
171
-
172
-
173
-
174
-
175
-
176
-
177
-
178
-
179
-
180
-
181
-
182
-
183
-
184
-
185
-
186
-
187
-
188
-
189
-
190
-
191
-
192
-
193
-
194
-
195
-
196
-
197
-
198
-
199
-
200
-
201
-
202
-
203
-
204
-
205
-
206
-
207
-
208
-
209
-
210
-
211
-
212
-
213
-
214
-
215
-
216
-
217
-
218
-
219
-
220
-
221
-
222
-
223
-
224
-
225
-
226
-
227
-
228
-
229
-
230
-
231
-
232
-
233
-
234
-
235
-
236
-
237
-
238
-
239
-
240
-
241
-
242
-
243
 |
 |

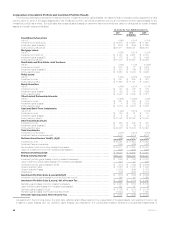
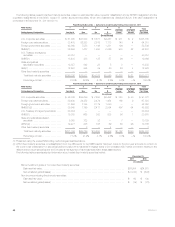
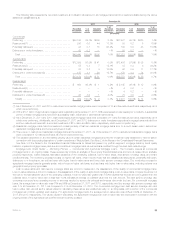
The following tables present total fixed maturity securities, based on estimated fair value, by sector classification and by NRSRO designation and the
equivalent designations of the NAIC, except for certain structured securities, which are presented as described above, that each designation is
comprised of at December 31, 2011and 2010:
Fixed Maturity Securities — by Sector & Credit Quality Rating at December 31, 2011
NAIC Rating: 1 2 3 4 5 6 Total
Estimated
Fair ValueRating Agency Designation: Aaa/Aa/A Baa Ba B Caa and
Lower In or Near
Default
(In millions)
U.S. corporate securities ............. $ 51,045 $41,533 $ 8,677 $4,257 $ 271 $ 2 $105,785
Foreign corporate securities ........... 33,403 26,383 2,915 1,173 140 4 64,018
Foreign government securities ......... 42,360 7,553 1,146 1,281 196 — 52,536
RMBS(1) .......................... 36,699 1,477 1,450 2,026 933 52 42,637
U.S. Treasury and agency
securities ....................... 40,012 — — — — — 40,012
CMBS(1) ......................... 18,403 388 125 57 96 — 19,069
State and political
subdivision securities .............. 12,357 842 23 5 8 — 13,235
ABS(1) ........................... 12,507 355 39 50 24 4 12,979
Other fixed maturity securities ......... — — — — — — —
Total fixed maturity securities ........ $246,786 $78,531 $14,375 $8,849 $1,668 $ 62 $350,271
Percentage of total ................ 70.5% 22.4% 4.1% 2.5% 0.5% —% 100.0%
Fixed Maturity Securities — by Sector & Credit Quality Rating at December 31, 2010
NAIC Rating: 1 2 3 4 5 6 Total
Rating Agency Designation: Aaa/Aa/A Baa Ba B Caa and
Lower In or Near
Default Estimated
Fair Value
(In millions)
U.S. corporate securities ............. $ 46,035 $34,259 $ 7,633 $3,452 $ 353 $ 40 $ 91,772
Foreign corporate securities ........... 39,430 24,352 2,474 1,454 169 9 67,888
Foreign government securities ......... 31,559 7,184 2,179 1,080 — — 42,002
RMBS(1)(2) ........................ 39,640 1,196 2,411 2,054 497 54 45,852
U.S. Treasury and agency securities .... 33,304 — — — — — 33,304
CMBS(1) ......................... 19,385 665 363 205 56 1 20,675
State and political subdivision
securities ....................... 9,368 722 32 — 7 — 10,129
ABS(1)(2) ......................... 12,477 348 198 59 60 26 13,168
Other fixed maturity securities ......... — 3 — 4 — — 7
Total fixed maturity securities ........ $231,198 $68,729 $15,290 $8,308 $1,142 $130 $324,797
Percentage of total ................ 71.2% 21.2% 4.7% 2.6% 0.3% —% 100.0%
(1) Presented using the revised NAIC rating methodologies described above.
(2) Within fixed maturity securities, a reclassification from the ABS sector to the RMBS sector has been made to the prior year amounts to conform to
the current year presentation for securities backed by sub-prime residential mortgage loans to be consistent with market convention relating to the
risks inherent in such securities and the Company’s management of its investments within these asset sectors.
The following table presents selected information about certain fixed maturity securities held at:
December 31,
2011 2010
(In millions)
Below investment grade or non-rated fixed maturity securities:
Estimated fair value .................................................................... $24,954 $24,870
Net unrealized gains (losses) ............................................................ $(1,310) $ (696)
Non-income producing fixed maturity securities:
Estimated fair value .................................................................... $ 62 $ 130
Net unrealized gains (losses) ............................................................ $ (19) $ (23)
48 MetLife, Inc.