MetLife 2011 Annual Report Download - page 53
Download and view the complete annual report
Please find page 53 of the 2011 MetLife annual report below. You can navigate through the pages in the report by either clicking on the pages listed below, or by using the keyword search tool below to find specific information within the annual report.-
 1
1 -
2
-
3
-
4
-
5
-
6
-
7
-
8
-
9
-
10
-
11
-
12
-
13
-
14
-
15
-
16
-
17
-
18
-
19
-
20
-
21
-
22
-
23
-
24
-
25
-
26
-
27
-
28
-
29
-
30
-
31
-
32
-
33
-
34
-
35
-
36
-
37
-
38
-
39
-
40
-
41
-
42
-
 43
43 -
 44
44 -
 45
45 -
 46
46 -
 47
47 -
 48
48 -
 49
49 -
 50
50 -
 51
51 -
 52
52 -
 53
53 -
 54
54 -
 55
55 -
 56
56 -
 57
57 -
 58
58 -
 59
59 -
 60
60 -
 61
61 -
 62
62 -
 63
63 -
64
-
65
-
66
-
67
-
68
-
69
-
70
-
71
-
72
-
73
-
74
-
75
-
76
-
77
-
78
-
79
-
80
-
81
-
82
-
83
-
84
-
85
-
86
-
87
-
88
-
89
-
90
-
91
-
92
-
93
-
94
-
95
-
96
-
97
-
98
-
99
-
100
-
101
-
102
-
103
-
104
-
105
-
106
-
107
-
108
-
109
-
110
-
111
-
112
-
113
-
114
-
115
-
116
-
117
-
118
-
119
-
120
-
121
-
122
-
123
-
124
-
125
-
126
-
127
-
128
-
129
-
130
-
131
-
132
-
133
-
134
-
135
-
136
-
137
-
138
-
139
-
140
-
141
-
142
-
143
-
144
-
145
-
146
-
147
-
148
-
149
-
150
-
151
-
152
-
153
-
154
-
155
-
156
-
157
-
158
-
159
-
160
-
161
-
162
-
163
-
164
-
165
-
166
-
167
-
168
-
169
-
170
-
171
-
172
-
173
-
174
-
175
-
176
-
177
-
178
-
179
-
180
-
181
-
182
-
183
-
184
-
185
-
186
-
187
-
188
-
189
-
190
-
191
-
192
-
193
-
194
-
195
-
196
-
197
-
198
-
199
-
200
-
201
-
202
-
203
-
204
-
205
-
206
-
207
-
208
-
209
-
210
-
211
-
212
-
213
-
214
-
215
-
216
-
217
-
218
-
219
-
220
-
221
-
222
-
223
-
224
-
225
-
226
-
227
-
228
-
229
-
230
-
231
-
232
-
233
-
234
-
235
-
236
-
237
-
238
-
239
-
240
-
241
-
242
-
243
 |
 |

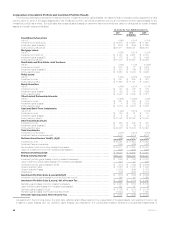
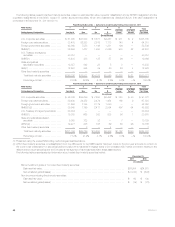
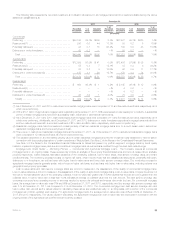
U.S. and Foreign Corporate Fixed Maturity Securities. The Company maintains a diversified portfolio of corporate fixed maturity securities across
industries and issuers. This portfolio does not have an exposure to any single issuer in excess of 1% of total investments. The tables below present
information for U.S. and foreign corporate securities at:
December 31,
2011 2010
Estimated
Fair
Value %of
Total
Estimated
Fair
Value %of
Total
(In millions) (In millions)
Corporate fixed maturity securities — by sector:
Foreign corporate fixed maturity securities(1) ............................. $ 64,018 37.7% $ 67,888 42.5%
U.S. corporate fixed maturity securities — by industry:
Industrial ......................................................... 26,962 15.9 22,070 13.8
Consumer ........................................................ 26,739 15.7 21,482 13.5
Finance .......................................................... 20,854 12.3 20,785 13.0
Utility ............................................................ 19,508 11.5 16,902 10.6
Communications ................................................... 8,178 4.8 7,335 4.6
Other ............................................................ 3,544 2.1 3,198 2.0
Total .......................................................... $169,803 100.0% $159,660 100.0%
(1) Includes U.S. dollar denominated and foreign denominated debt obligations of foreign obligors and other foreign fixed maturity securities.
December 31,
2011 2010
Estimated
Fair
Value % of Total
Investments
Estimated
Fair
Value % of Total
Investments
(In millions) (In millions)
Concentrations within corporate fixed maturity securities:
Largest exposure to a single issuer .............................. $ 1,642 0.3% $ 2,291 0.5%
Holdings in ten issuers with the largest exposures .................. $10,716 2.1% $14,247 3.1%
Structured Securities. The following table presents information about structured securities at:
December 31,
2011 2010
Estimated
Fair
Value %of
Total
Estimated
Fair
Value %of
Total
(In millions)
RMBS ............................................................... $42,637 57.1% $45,852 57.5%
CMBS ............................................................... 19,069 25.5 20,675 26.0
ABS................................................................. 12,979 17.4 13,168 16.5
Total structured securities .............................................. $74,685 100.0% $79,695 100.0%
Ratings profile:
RMBS rated Aaa/AAA ................................................. $31,690 74.3% $36,244 79.0%
RMBS rated NAIC 1 .................................................. $36,699 86.1% $39,640 86.5%
CMBS rated Aaa/AAA ................................................. $15,785 82.8% $16,901 81.7%
CMBS rated NAIC 1 .................................................. $18,403 96.5% $19,385 93.7%
ABS rated Aaa/AAA ................................................... $ 8,223 63.4% $10,252 77.9%
ABS rated NAIC 1 .................................................... $12,507 96.4% $12,477 94.8%
MetLife, Inc. 49