MetLife 2011 Annual Report Download - page 128
Download and view the complete annual report
Please find page 128 of the 2011 MetLife annual report below. You can navigate through the pages in the report by either clicking on the pages listed below, or by using the keyword search tool below to find specific information within the annual report.-
 1
1 -
2
-
3
-
4
-
5
-
6
-
7
-
8
-
9
-
10
-
11
-
12
-
13
-
14
-
15
-
16
-
17
-
18
-
19
-
20
-
21
-
22
-
23
-
24
-
25
-
26
-
27
-
28
-
29
-
30
-
31
-
32
-
33
-
34
-
35
-
36
-
37
-
38
-
39
-
40
-
41
-
42
-
43
-
44
-
45
-
46
-
47
-
48
-
49
-
50
-
51
-
52
-
53
-
54
-
55
-
56
-
57
-
58
-
59
-
60
-
61
-
62
-
63
-
64
-
65
-
66
-
67
-
68
-
69
-
70
-
71
-
72
-
73
-
74
-
75
-
76
-
77
-
78
-
79
-
80
-
81
-
82
-
83
-
84
-
85
-
86
-
87
-
88
-
89
-
90
-
91
-
92
-
93
-
94
-
95
-
96
-
97
-
98
-
99
-
100
-
101
-
102
-
103
-
104
-
105
-
106
-
107
-
108
-
109
-
110
-
111
-
112
-
113
-
114
-
115
-
116
-
117
-
 118
118 -
 119
119 -
 120
120 -
 121
121 -
 122
122 -
 123
123 -
 124
124 -
 125
125 -
 126
126 -
 127
127 -
 128
128 -
 129
129 -
 130
130 -
 131
131 -
 132
132 -
 133
133 -
 134
134 -
 135
135 -
 136
136 -
 137
137 -
 138
138 -
139
-
140
-
141
-
142
-
143
-
144
-
145
-
146
-
147
-
148
-
149
-
150
-
151
-
152
-
153
-
154
-
155
-
156
-
157
-
158
-
159
-
160
-
161
-
162
-
163
-
164
-
165
-
166
-
167
-
168
-
169
-
170
-
171
-
172
-
173
-
174
-
175
-
176
-
177
-
178
-
179
-
180
-
181
-
182
-
183
-
184
-
185
-
186
-
187
-
188
-
189
-
190
-
191
-
192
-
193
-
194
-
195
-
196
-
197
-
198
-
199
-
200
-
201
-
202
-
203
-
204
-
205
-
206
-
207
-
208
-
209
-
210
-
211
-
212
-
213
-
214
-
215
-
216
-
217
-
218
-
219
-
220
-
221
-
222
-
223
-
224
-
225
-
226
-
227
-
228
-
229
-
230
-
231
-
232
-
233
-
234
-
235
-
236
-
237
-
238
-
239
-
240
-
241
-
242
-
243
 |
 |

MetLife, Inc.
Notes to the Consolidated Financial Statements — (Continued)
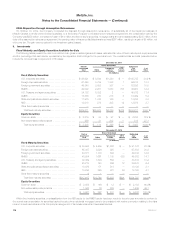
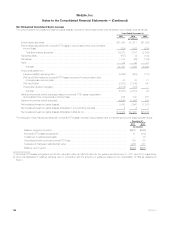
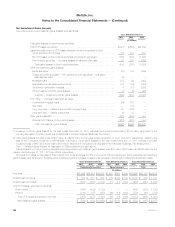
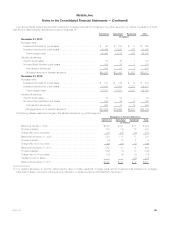
Concentration of Gross Unrealized Losses and OTTI Losses for Fixed Maturity and Equity Securities Available-for-Sale
The gross unrealized losses related to fixed maturity and equity securities, including the portion of OTTI losses on fixed maturity securities recognized
in accumulated other comprehensive income (loss) were $5.8 billion and $6.8 billion at December 31, 2011 and 2010, respectively. The concentration,
calculated as a percentage of gross unrealized losses (including OTTI losses), by sector and industry was as follows at:
December 31,
2011 2010
Sector:
RMBS ...................................................................................... 30% 25%
U.S. corporate securities ........................................................................ 24 23
Foreign corporate securities ..................................................................... 23 14
Foreign government securities .................................................................... 6 9
ABS ........................................................................................ 5 5
CMBS ...................................................................................... 4 4
State and political subdivision securities ............................................................ 3 8
U.S. Treasury and agency securities ............................................................... — 8
Other ....................................................................................... 5 4
Total ...................................................................................... 100% 100%
Industry:
Mortgage-backed ............................................................................. 34% 29%
Finance ..................................................................................... 27 21
Utility ....................................................................................... 8 5
Foreign government securities .................................................................... 6 9
Consumer ................................................................................... 6 4
Asset-backed ................................................................................ 5 5
Communications .............................................................................. 3 2
State and political subdivision securities ............................................................ 3 8
Industrial ..................................................................................... 2 2
U.S. Treasury and agency securities ............................................................... — 8
Other ....................................................................................... 6 7
Total ...................................................................................... 100% 100%
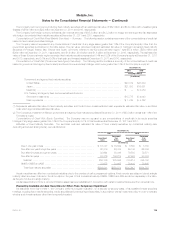
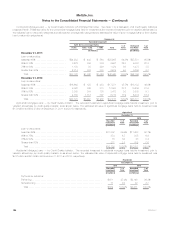
Evaluating Temporarily Impaired Available-for-Sale Securities
The following table presents fixed maturity and equity securities, each with gross unrealized losses of greater than $10 million, the number of
securities, total gross unrealized losses and percentage of total gross unrealized losses at:
December 31,
2011 2010
Fixed Maturity
Securities Equity
Securities Fixed Maturity
Securities Equity
Securities
(In millions, except number of securities)
Number of securities .......................................... 96 8 107 6
Total gross unrealized losses .................................... $1,703 $117 $2,014 $103
Percentage of total gross unrealized losses ......................... 31% 39% 31% 43%
Fixed maturity and equity securities, each with gross unrealized losses greater than $10 million, decreased $297 million during the year ended
December 31, 2011. The decline in, or improvement in, gross unrealized losses for the year ended December 31, 2011, was primarily attributable to a
decrease in interest rates, partially offset by widening credit spreads. These securities were included in the Company’s OTTI review process.
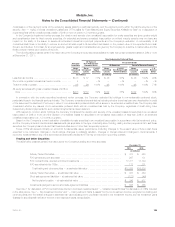
As of December 31, 2011, $1.3 billion of unrealized losses were from fixed maturity securities with an unrealized loss position of 20% or more of
amortized cost for six months or greater. Of the $1.3 billion, $526 million, or 41%, are related to unrealized losses on investment grade securities.
Unrealized losses on investment grade securities are principally related to widening credit spreads or rising interest rates since purchase. Of the
$1.3 billion, $759 million, or 59%, are related to unrealized losses on below investment grade securities. Unrealized losses on below investment grade
securities are principally related to RMBS (primarily alternative residential mortgage loans and sub-prime residential mortgage loans), U.S and foreign
corporate securities (primarily utility, industrial and financial services industry securities) and ABS (primarily collateralized debt obligations) and were the
result of significantly wider credit spreads resulting from higher risk premiums since purchase, largely due to economic and market uncertainties
including concerns over the financial services industry sector, unemployment levels and valuations of residential real estate supporting non-agency
RMBS. As explained further in Note 1, management evaluates these U.S. and foreign corporate securities based on factors such as expected cash
flows and the financial condition and near-term and long-term prospects of the issuer; and evaluates non-agency RMBS and ABS based on actual and
projected cash flows after considering the quality of underlying collateral, expected prepayment speeds, current and forecasted loss severity,
124 MetLife, Inc.