MetLife 2011 Annual Report Download - page 51
Download and view the complete annual report
Please find page 51 of the 2011 MetLife annual report below. You can navigate through the pages in the report by either clicking on the pages listed below, or by using the keyword search tool below to find specific information within the annual report.
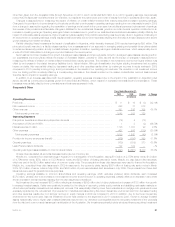
data. This may be due to a significant increase in market activity, a specific event, or one or more significant input(s) becoming observable. Transfers
into and/or out of any level are assumed to occur at the beginning of the period. Significant transfers into and/or out of Level 3 assets and liabilities for
the year ended December 31, 2011 are summarized below:
• During the year ended December 31, 2011, fixed maturity securities transfers into Level 3 of $599 million resulted primarily from current market
conditions characterized by a lack of trading activity, decreased liquidity and credit ratings downgrades (e.g., from investment grade to below
investment grade). These current market conditions have resulted in decreased transparency of valuations and an increased use of broker
quotations and unobservable inputs to determine estimated fair value principally for certain U.S. and foreign corporate securities and foreign
government securities.
• During the year ended December 31, 2011, fixed maturity securities transfers out of Level 3 of ($6.7) billion resulted primarily from increased
transparency of both new issuances that, subsequent to issuance and establishment of trading activity, became priced by independent
pricing services and existing issuances that, over time, the Company was able to obtain pricing from, or corroborate pricing received from
independent pricing services with observable inputs, or there were increases in market activity and upgraded credit ratings primarily for ABS,
foreign government securities, U.S. and foreign corporate securities and RMBS.
See “— Summary of Critical Accounting Estimates — Estimated Fair Value of Investments” for further information on the estimates and assumptions
that affect the amounts reported above.
See Note 5 of the Notes to the Consolidated Financial Statements for further information about the valuation techniques and inputs by level by major
classes of invested assets that affect the amounts reported above.
Fixed Maturity Securities. See Note 3 of the Notes to the Consolidated Financial Statements for information about:
• Fixed maturity and equity securities on a sector basis and the related cost or amortized cost, gross unrealized gains and losses, including the
noncredit loss component of OTTI loss, and estimated fair value of such securities at December 31, 2011 and 2010;
• Government and agency securities holdings in excess of 10% of the Company’s equity at December 31, 2011 and 2010; and
• Maturities of fixed maturity securities at December 31, 2011 and 2010.
Fixed Maturity Securities Credit Quality — Ratings. The Securities Valuation Office of the National Association of Insurance Commissioners (“NAIC”)
evaluates the fixed maturity security investments of insurers for regulatory reporting and capital assessment purposes and assigns securities to one of
six credit quality categories called “NAIC designations.” If no rating is available from the NAIC, then as permitted by the NAIC, an internally developed
rating is used. The NAIC ratings are generally similar to the credit quality designations of the Nationally Recognized Statistical Ratings Organizations
(“NRSROs”) for marketable fixed maturity securities, called “rating agency designations,” except for certain structured securities as described below.
NAIC ratings 1 and 2 include fixed maturity securities generally considered investment grade (i.e., rated “Baa3” or better by Moody’s or rated “BBB” or
better by S&P and Fitch) by such rating organizations. NAIC ratings 3 through 6 include fixed maturity securities generally considered below investment
grade (i.e., rated “Ba1” or lower by Moody’s or rated “BB+” or lower by S&P and Fitch) by such rating organizations. Rating agency designations are
based on availability of applicable ratings from rating agencies on the NAIC acceptable rating organizations list, including Moody’s, S&P, Fitch and
Realpoint, LLC. If no rating is available from a rating agency, then an internally developed rating is used.
The NAIC adopted revised rating methodologies for certain structured securities comprised of non-agency RMBS, CMBS and ABS. The NAIC’s
objective with the revised rating methodologies for these structured securities was to increase the accuracy in assessing expected losses, and to use
the improved assessment to determine a more appropriate capital requirement for such structured securities. The revised methodologies reduce
regulatory reliance on rating agencies and allow for greater regulatory input into the assumptions used to estimate expected losses from structured
securities. The Company applies the revised NAIC rating methodologies to structured securities held by MetLife, Inc.’s insurance subsidiaries that file
NAIC statutory financial statements. The NAIC’s present methodology is to evaluate structured securities held by insurers using the revised NAIC rating
methodologies on an annual basis. If such insurance subsidiaries of the Company acquire structured securities that have not been previously evaluated
by the NAIC, but are expected to be evaluated by the NAIC in the upcoming annual review, an internally developed rating is used until a final rating
becomes available.
The four tables below present fixed maturity securities based on rating agency designations and equivalent designations of the NAIC, with the
exception of certain structured securities described above. These structured securities are presented based on ratings from the revised NAIC rating
methodologies described above (which may not correspond to rating agency designations). All NAIC designation (e.g., NAIC 1 — 6) amounts and
percentages presented herein are based on the revised NAIC methodologies described above. All rating agency designation (e.g., Aaa/AAA) amounts
and percentages presented herein are based on rating agency designations without adjustment for the revised NAIC methodologies described above.
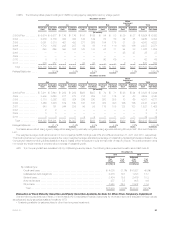
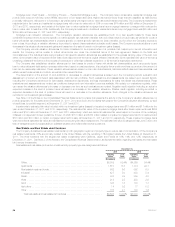
The following table presents total fixed maturity securities by NRSRO designation and the equivalent designations of the NAIC, except for certain
structured securities, which are presented as described above, as well as the percentage, based on estimated fair value, that each designation is
comprised of at:
December 31,
2011 2010
NAIC
Rating Rating Agency Designation Amortized
Cost
Estimated
Fair
Value %of
Total Amortized
Cost
Estimated
Fair
Value %of
Total
(In millions)
1 Aaa/Aa/A ........................... $230,195 $246,786 70.5% $226,639 $231,198 71.2%
2 Baa ................................ 73,352 78,531 22.4 65,412 68,729 21.2
3 Ba ................................. 14,604 14,375 4.1 15,331 15,290 4.7
4 B .................................. 9,437 8,849 2.5 8,742 8,308 2.6
5 Caa and lower ....................... 2,142 1,668 0.5 1,340 1,142 0.3
6 In or near default ...................... 81 62 — 153 130 —
Total fixed maturity securities ............ $329,811 $350,271 100.0% $317,617 $324,797 100.0%
MetLife, Inc. 47


