MetLife 2011 Annual Report Download - page 157
Download and view the complete annual report
Please find page 157 of the 2011 MetLife annual report below. You can navigate through the pages in the report by either clicking on the pages listed below, or by using the keyword search tool below to find specific information within the annual report.-
 1
1 -
2
-
3
-
4
-
5
-
6
-
7
-
8
-
9
-
10
-
11
-
12
-
13
-
14
-
15
-
16
-
17
-
18
-
19
-
20
-
21
-
22
-
23
-
24
-
25
-
26
-
27
-
28
-
29
-
30
-
31
-
32
-
33
-
34
-
35
-
36
-
37
-
38
-
39
-
40
-
41
-
42
-
43
-
44
-
45
-
46
-
47
-
48
-
49
-
50
-
51
-
52
-
53
-
54
-
55
-
56
-
57
-
58
-
59
-
60
-
61
-
62
-
63
-
64
-
65
-
66
-
67
-
68
-
69
-
70
-
71
-
72
-
73
-
74
-
75
-
76
-
77
-
78
-
79
-
80
-
81
-
82
-
83
-
84
-
85
-
86
-
87
-
88
-
89
-
90
-
91
-
92
-
93
-
94
-
95
-
96
-
97
-
98
-
99
-
100
-
101
-
102
-
103
-
104
-
105
-
106
-
107
-
108
-
109
-
110
-
111
-
112
-
113
-
114
-
115
-
116
-
117
-
118
-
119
-
120
-
121
-
122
-
123
-
124
-
125
-
126
-
127
-
128
-
129
-
130
-
131
-
132
-
133
-
134
-
135
-
136
-
137
-
138
-
139
-
140
-
141
-
142
-
143
-
144
-
145
-
146
-
 147
147 -
 148
148 -
 149
149 -
 150
150 -
 151
151 -
 152
152 -
 153
153 -
 154
154 -
 155
155 -
 156
156 -
 157
157 -
 158
158 -
 159
159 -
 160
160 -
 161
161 -
 162
162 -
 163
163 -
 164
164 -
 165
165 -
 166
166 -
 167
167 -
168
-
169
-
170
-
171
-
172
-
173
-
174
-
175
-
176
-
177
-
178
-
179
-
180
-
181
-
182
-
183
-
184
-
185
-
186
-
187
-
188
-
189
-
190
-
191
-
192
-
193
-
194
-
195
-
196
-
197
-
198
-
199
-
200
-
201
-
202
-
203
-
204
-
205
-
206
-
207
-
208
-
209
-
210
-
211
-
212
-
213
-
214
-
215
-
216
-
217
-
218
-
219
-
220
-
221
-
222
-
223
-
224
-
225
-
226
-
227
-
228
-
229
-
230
-
231
-
232
-
233
-
234
-
235
-
236
-
237
-
238
-
239
-
240
-
241
-
242
-
243
 |
 |

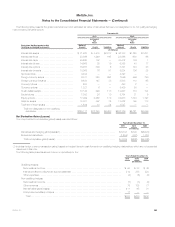
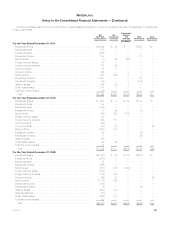
MetLife, Inc.
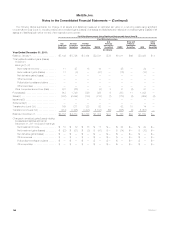
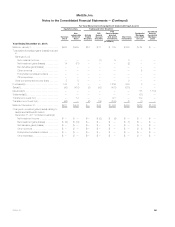
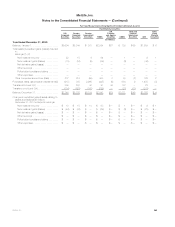
Notes to the Consolidated Financial Statements — (Continued)
December 31, 2010
Fair Value Measurements at Reporting Date Using
Quoted Prices in
Active Markets for
Identical Assets
and Liabilities
(Level 1)
Significant Other
Observable
Inputs
(Level 2)
Significant
Unobservable
Inputs
(Level 3)
Total
Estimated
Fair
Value
(In millions)
Other invested assets:
MSRs .................................................................. — — 950 950
Other investments ........................................................ 373 121 — 494
Derivative assets:(3) .......................................................
Interest rate contracts ................................................... 131 3,583 39 3,753
Foreign currency contracts ............................................... 2 1,711 74 1,787
Credit contracts ........................................................ — 125 50 175
Equity market contracts .................................................. 23 1,757 282 2,062
Total derivative assets ................................................. 156 7,176 445 7,777
Total other invested assets ............................................ 529 7,297 1,395 9,221
Net embedded derivatives within asset host contracts(4) ............................ — — 185 185
Separate account assets(5) .................................................. 25,566 155,589 1,983 183,138
Total assets ............................................................. $51,247 $477,044 $29,156 $557,447
Liabilities:
Derivative liabilities:(3)
Interest rate contracts ..................................................... $ 35 $ 1,598 $ 125 $ 1,758
Foreign currency contracts ................................................. — 1,372 1 1,373
Credit contracts .......................................................... — 101 6 107
Equity market contracts .................................................... 10 1,174 140 1,324
Total derivative liabilities .................................................. 45 4,245 272 4,562
Net embedded derivatives within liability host contracts(4) ........................... — 11 2,623 2,634
Long-term debt of CSEs ..................................................... — 6,636 184 6,820
Trading liabilities(6) .......................................................... 46 — — 46
Total liabilities ............................................................ $ 91 $ 10,892 $ 3,079 $ 14,062
(1) Short-term investments as presented in the tables above differ from the amounts presented in the consolidated balance sheets because certain
short-term investments are not measured at estimated fair value (e.g., time deposits, etc.), and therefore are excluded from the tables presented
above.
(2) Mortgage loans held-for-sale as presented in the tables above differ from the amount presented in the consolidated balance sheets as these tables
do not include mortgage loans that were previously designated as held-for-investment, but now are designated as held-for-sale and stated at lower
of amortized cost or estimated fair value.
(3) Derivative liabilities are presented within other liabilities in the consolidated balance sheets. The amounts are presented gross in the tables above to
reflect the presentation in the consolidated balance sheets, but are presented net for purposes of the rollforward in the Fair Value Measurements
Using Significant Unobservable Inputs (Level 3) tables which follow. At December 31, 2010 there were $185 million of non-derivative hedging
instruments, carried at amortized cost, which are included within the liabilities total in Note 4 but excluded from derivative liabilities in the tables above
as they are not derivative instruments. At December 31, 2011, there were no non-derivative hedging instruments.
(4) Net embedded derivatives within asset host contracts are presented primarily within premiums, reinsurance and other receivables in the
consolidated balance sheets. Net embedded derivatives within liability host contracts are presented primarily within PABs in the consolidated
balance sheets. At December 31, 2011, fixed maturity securities and equity securities also included embedded derivatives of $2 million and
($72) million, respectively. At December 31, 2010, fixed maturity securities and equity securities included embedded derivatives of $5 million and
($62) million, respectively.
(5) Separate account assets are measured at estimated fair value. Investment performance related to separate account assets is fully offset by
corresponding amounts credited to contractholders whose liability is reflected within separate account liabilities. Separate account liabilities are set
equal to the estimated fair value of separate account assets.
(6) The liability related to securitized reverse residential mortgage loans and trading liabilities are presented within other liabilities in the consolidated
balance sheets.
See Note 3 for discussion of CSEs included in the tables above and for certain amounts in prior year footnote disclosures which have been
reclassified to conform with the 2011 presentation.
MetLife, Inc. 153