MetLife 2011 Annual Report Download - page 12
Download and view the complete annual report
Please find page 12 of the 2011 MetLife annual report below. You can navigate through the pages in the report by either clicking on the pages listed below, or by using the keyword search tool below to find specific information within the annual report.-
 1
1 -
 2
2 -
 3
3 -
 4
4 -
 5
5 -
 6
6 -
 7
7 -
 8
8 -
 9
9 -
 10
10 -
 11
11 -
 12
12 -
 13
13 -
 14
14 -
 15
15 -
 16
16 -
 17
17 -
 18
18 -
 19
19 -
 20
20 -
 21
21 -
 22
22 -
23
-
24
-
25
-
26
-
27
-
28
-
29
-
30
-
31
-
32
-
33
-
34
-
35
-
36
-
37
-
38
-
39
-
40
-
41
-
42
-
43
-
44
-
45
-
46
-
47
-
48
-
49
-
50
-
51
-
52
-
53
-
54
-
55
-
56
-
57
-
58
-
59
-
60
-
61
-
62
-
63
-
64
-
65
-
66
-
67
-
68
-
69
-
70
-
71
-
72
-
73
-
74
-
75
-
76
-
77
-
78
-
79
-
80
-
81
-
82
-
83
-
84
-
85
-
86
-
87
-
88
-
89
-
90
-
91
-
92
-
93
-
94
-
95
-
96
-
97
-
98
-
99
-
100
-
101
-
102
-
103
-
104
-
105
-
106
-
107
-
108
-
109
-
110
-
111
-
112
-
113
-
114
-
115
-
116
-
117
-
118
-
119
-
120
-
121
-
122
-
123
-
124
-
125
-
126
-
127
-
128
-
129
-
130
-
131
-
132
-
133
-
134
-
135
-
136
-
137
-
138
-
139
-
140
-
141
-
142
-
143
-
144
-
145
-
146
-
147
-
148
-
149
-
150
-
151
-
152
-
153
-
154
-
155
-
156
-
157
-
158
-
159
-
160
-
161
-
162
-
163
-
164
-
165
-
166
-
167
-
168
-
169
-
170
-
171
-
172
-
173
-
174
-
175
-
176
-
177
-
178
-
179
-
180
-
181
-
182
-
183
-
184
-
185
-
186
-
187
-
188
-
189
-
190
-
191
-
192
-
193
-
194
-
195
-
196
-
197
-
198
-
199
-
200
-
201
-
202
-
203
-
204
-
205
-
206
-
207
-
208
-
209
-
210
-
211
-
212
-
213
-
214
-
215
-
216
-
217
-
218
-
219
-
220
-
221
-
222
-
223
-
224
-
225
-
226
-
227
-
228
-
229
-
230
-
231
-
232
-
233
-
234
-
235
-
236
-
237
-
238
-
239
-
240
-
241
-
242
-
243
 |
 |

On November 1, 2010 (the “Acquisition Date”), MetLife, Inc. completed the acquisition of American Life Insurance Company (“American Life”) from
AM Holdings LLC (formerly known as ALICO Holdings LLC) (“AM Holdings”), a subsidiary of American International Group, Inc. (“AIG”), and Delaware
American Life Insurance Company (“DelAm”) from AIG (American Life, together with DelAm, collectively, “ALICO”) (the “Acquisition”). ALICO’s fiscal
year-end is November 30. Accordingly, the Company’s consolidated financial statements reflect the assets and liabilities of ALICO as of November 30,
2011 and 2010, and the operating results of ALICO for the year ended November 30, 2011 and the one month ended November 30, 2010. The
assets, liabilities and operating results relating to the Acquisition are included in the Japan and Other International Regions segments. Prior year results
have been adjusted to conform to the current year presentation of segments. See Note 2 of the Notes to the Consolidated Financial Statements.
We continue to experience an increase in market share and sales in several of our businesses; however, the general economic conditions, including
the high levels of unemployment, negatively impacted the demand for certain of our products. Portfolio growth in response to the higher sales levels
drove improved investment results despite lower yields experienced in connection with the continued decline in interest rates in 2011. The declining
interest rate environment, however, also generated significant derivative gains in 2011. Current year results were negatively impacted by severe weather,
including the earthquake and tsunami in Japan in the first quarter, record numbers of tornadoes in the second quarter and Hurricane Irene in the third
quarter.
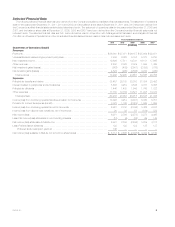
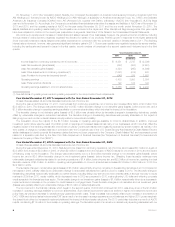
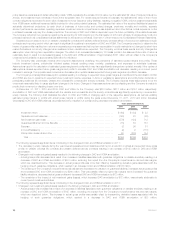
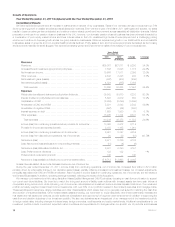
Years Ended December 31,
2011 2010 2009
(In millions)
Income (loss) from continuing operations, net of income tax ......................... $ 6,951 $ 2,747 $ (2,336)
Less: Net investment gains (losses) ............................................ (867) (408) (2,901)
Less: Net derivative gains (losses) ............................................. 4,824 (265) (4,866)
Less: Other adjustments to continuing operations (1) .............................. (1,641) (914) 480
Less: Provision for income tax (expense) benefit .................................. (845) 379 2,597
Operating earnings ......................................................... 5,480 3,955 2,354
Less: Preferred stock dividends ............................................... 122 122 122
Operating earnings available to common shareholders ............................. $ 5,358 $ 3,833 $ 2,232
(1) See definitions of operating revenues and operating expenses for the components of such adjustments.
Year Ended December 31, 2011 compared with the Year Ended December 31, 2010
Unless otherwise stated, all amounts discussed below are net of income tax.
During the year ended December 31, 2011, income (loss) from continuing operations, net of income tax, increased $4.2 billion to $7.0 billion from
$2.8 billion in 2010. The change was predominantly due to a $5.1 billion favorable change in net derivative gains (losses), before income tax, and a
$1.5 billion favorable change in operating earnings available to common shareholders, which includes the impact of the Acquisition.
The favorable change in net derivative gains (losses) of $3.3 billion was primarily driven by favorable changes in freestanding derivatives, partially
offset by unfavorable changes in embedded derivatives. The favorable change in freestanding derivatives was primarily attributable to the impact of
falling long-term and mid-term interest rates and equity market movements and volatility.
The Acquisition drove the majority of the $1.5 billion increase in operating earnings available to common shareholders. In addition, improved
investment performance was the result of portfolio growth in response to increased sales across many of our businesses, which more than offset the
negative impact of the declining interest rate environment on yields. Current year results were negatively impacted by severe weather, as well as, in the
third quarter, a charge to increase reserves in connection with the Company’s use of the U.S. Social Security Administration’s Death Master File and
similar databases to identify potential life insurance claims that have not been presented to the Company (“Death Master File”) and expenses incurred
related to a liquidation plan filed by the New York State Department of Financial Services (the “Department of Financial Services”) for Executive Life
Insurance Company of New York (“ELNY”).
Year Ended December 31, 2010 compared with the Year Ended December 31, 2009
Unless otherwise stated, all amounts discussed below are net of income tax.
During the year ended December 31, 2010, MetLife’s income (loss) from continuing operations, net of income tax increased $5.1 billion to a gain of
$2.8 billion from a loss of $2.3 billion in 2009, of which $2 million in losses is from the inclusion of ALICO results for one month in 2010 and the impact
of financing costs for the Acquisition. The change was predominantly due to a $4.6 billion favorable change in net derivative gains (losses), before
income tax, and a $2.5 billion favorable change in net investment gains (losses), before income tax. Offsetting these favorable variances were
unfavorable changes in adjustments related to continuing operations of $1.4 billion, before income tax, and $2.2 billion of income tax, resulting in a total
favorable variance of $3.5 billion. In addition, operating earnings available to common shareholders increased $1.6 billion to $3.8 billion in 2010 from
$2.2 billion in 2009.
The favorable change in net derivative gains (losses) of $3.0 billion was primarily driven by net gains on freestanding derivatives in 2010 compared to
net losses in 2009, partially offset by an unfavorable change in embedded derivatives from gains in 2009 to losses in 2010. The favorable change in
freestanding derivatives was primarily attributable to market factors, including falling long-term and mid-term interest rates, a stronger recovery in equity
markets in 2009 than 2010, equity volatility, which decreased more in 2009 as compared to 2010, a strengthening U.S. dollar and widening corporate
credit spreads in the financial services sector. The favorable change in net investment gains (losses) of $1.6 billion was primarily driven by a decrease in
impairments and a decrease in the provision for credit losses on mortgage loans. These favorable changes in net derivative and net investment gains
(losses) were partially offset by an unfavorable change of $518 million in related adjustments.
The improvement in the financial markets, which began in the second quarter of 2009 and continued into 2010, was a key driver of the $1.6 billion
increase in operating earnings available to common shareholders. Such market improvement was most evident in higher net investment income and
policy fees, as well as a decrease in variable annuity guarantee benefit costs. These increases were partially offset by an increase in amortization of
DAC, VOBA and deferred sales inducements (“DSI”) as a result of an increase in average separate account balances and higher 2010 gross margins in
the closed block driven by increased investment yields and the impact of dividend scale reductions. The 2010 period also includes one month of ALICO
results, contributing $114 million to the increase in operating earnings. The favorable impact of a reduction in discretionary spending associated with our
8MetLife, Inc.