MetLife 2011 Annual Report Download - page 33
Download and view the complete annual report
Please find page 33 of the 2011 MetLife annual report below. You can navigate through the pages in the report by either clicking on the pages listed below, or by using the keyword search tool below to find specific information within the annual report.-
 1
1 -
2
-
3
-
4
-
5
-
6
-
7
-
8
-
9
-
10
-
11
-
12
-
13
-
14
-
15
-
16
-
17
-
18
-
19
-
20
-
21
-
22
-
 23
23 -
 24
24 -
 25
25 -
 26
26 -
 27
27 -
 28
28 -
 29
29 -
 30
30 -
 31
31 -
 32
32 -
 33
33 -
 34
34 -
 35
35 -
 36
36 -
 37
37 -
 38
38 -
 39
39 -
 40
40 -
 41
41 -
 42
42 -
 43
43 -
44
-
45
-
46
-
47
-
48
-
49
-
50
-
51
-
52
-
53
-
54
-
55
-
56
-
57
-
58
-
59
-
60
-
61
-
62
-
63
-
64
-
65
-
66
-
67
-
68
-
69
-
70
-
71
-
72
-
73
-
74
-
75
-
76
-
77
-
78
-
79
-
80
-
81
-
82
-
83
-
84
-
85
-
86
-
87
-
88
-
89
-
90
-
91
-
92
-
93
-
94
-
95
-
96
-
97
-
98
-
99
-
100
-
101
-
102
-
103
-
104
-
105
-
106
-
107
-
108
-
109
-
110
-
111
-
112
-
113
-
114
-
115
-
116
-
117
-
118
-
119
-
120
-
121
-
122
-
123
-
124
-
125
-
126
-
127
-
128
-
129
-
130
-
131
-
132
-
133
-
134
-
135
-
136
-
137
-
138
-
139
-
140
-
141
-
142
-
143
-
144
-
145
-
146
-
147
-
148
-
149
-
150
-
151
-
152
-
153
-
154
-
155
-
156
-
157
-
158
-
159
-
160
-
161
-
162
-
163
-
164
-
165
-
166
-
167
-
168
-
169
-
170
-
171
-
172
-
173
-
174
-
175
-
176
-
177
-
178
-
179
-
180
-
181
-
182
-
183
-
184
-
185
-
186
-
187
-
188
-
189
-
190
-
191
-
192
-
193
-
194
-
195
-
196
-
197
-
198
-
199
-
200
-
201
-
202
-
203
-
204
-
205
-
206
-
207
-
208
-
209
-
210
-
211
-
212
-
213
-
214
-
215
-
216
-
217
-
218
-
219
-
220
-
221
-
222
-
223
-
224
-
225
-
226
-
227
-
228
-
229
-
230
-
231
-
232
-
233
-
234
-
235
-
236
-
237
-
238
-
239
-
240
-
241
-
242
-
243
 |
 |

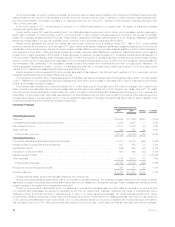
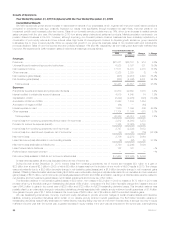
U.S. dollar and widening corporate credit spreads in the financial services sector. Falling long-term and mid-term interest rates in the current year
compared to rising long-term and mid-term interest rates in the prior year had a positive impact of $2.6 billion on our interest rate derivatives,
$931 million of which is attributable to hedges of variable annuity minimum benefit guarantee liabilities, which are accounted for as embedded
derivatives. In addition, stronger equity market recovery and lower equity market volatility in the prior year as compared to the current year had a positive
impact of $1.1 billion on our equity derivatives, which we use to hedge variable annuity minimum benefit guarantees. U.S. dollar strengthening had a
positive impact of $554 million on certain of our foreign currency derivatives, which are used to hedge foreign-denominated asset and liability
exposures. Finally, widening corporate credit spreads in the financial services sector had a positive impact of $221 million on our purchased protection
credit derivatives.
Certain variable annuity products with minimum benefit guarantees contain embedded derivatives that are measured at estimated fair value
separately from the host variable annuity contract, with changes in estimated fair value reported in net derivative gains (losses). These embedded
derivatives also include an adjustment for nonperformance risk of the related liabilities carried at estimated fair value. The $1.4 billion unfavorable change
in embedded derivatives was primarily attributable to the impact of market factors, including falling long-term and mid-term interest rates, changes in
foreign currency exchange rates, equity volatility and equity market movements. Falling long-term and mid-term interest rates in the current year
compared to rising long-term and mid-term interest rates in the prior year had a negative impact of $1.4 billion. Changes in foreign currency exchange
rates had a negative impact of $468 million. Equity volatility decreased more in the prior year than in the current year causing a negative impact of
$284 million, and a stronger recovery in the equity markets in the prior year than in the current year had a negative impact of $228 million. The
unfavorable impact from these hedged risks was partially offset by a favorable change related to the adjustment for nonperformance risk of $1.2 billion,
from losses of $1.3 billion in 2009 to losses of $62 million in 2010. This $62 million loss was net of a $621 million loss related to a refinement in
estimating the spreads used in the adjustment for nonperformance risk made in the second quarter of 2010. Gains on the freestanding derivatives that
hedged these embedded derivative risks largely offset the change in liabilities attributable to market factors, excluding the adjustment for
nonperformance risk, which does not have an economic impact on the Company.
Improved or stabilizing market conditions across several invested asset classes and sectors as compared to the prior year resulted in decreases in
impairments and in net realized losses from sales and disposals of investments in most components of our investment portfolio. These decreases,
coupled with a decrease in the provision for credit losses on mortgage loans due to improved market conditions, resulted in a $1.6 billion improvement
in net investment gains (losses).
Income from continuing operations, net of income tax for 2010 includes $138 million of expenses related to the acquisition and integration of ALICO.
These expenses, which primarily consisted of investment banking and legal fees, are recorded in Corporate & Other and are not a component of
operating earnings.
Income tax expense for the year ended December 31, 2010 was $1.2 billion, or 30% of income from continuing operations before provision for
income tax, compared with income tax benefit of $2.0 billion, or 46% of the loss from continuing operations before benefit for income tax, for the
comparable 2009 period. The Company’s 2010 and 2009 effective tax rates differ from the U.S. statutory rate of 35% primarily due to the impact of
certain permanent tax differences, including non-taxable investment income and tax credits for investments in low income housing, in relation to income
(loss) from continuing operations before income tax, as well as certain foreign permanent tax differences.
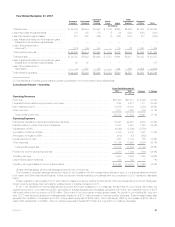
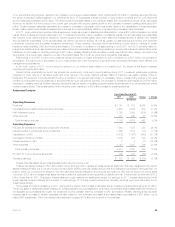
As more fully described in the discussion of performance measures above, we use operating earnings, which does not equate to income (loss) from
continuing operations as determined in accordance with GAAP, to analyze our performance, evaluate segment performance, and allocate resources.
Operating earnings is also a measure by which senior management’s and many other employees’ performance is evaluated for the purpose of
determining their compensation under applicable compensation plans. We believe that the presentation of operating earnings, as we measure it for
management purposes, enhances the understanding of our performance by highlighting the results of operations and the underlying profitability drivers
of the business. Operating earnings should not be viewed as a substitute for GAAP income (loss) from continuing operations, net of income tax.
Operating earnings available to common shareholders increased by $1.6 billion to $3.8 billion in 2010 from $2.2 billion in 2009.
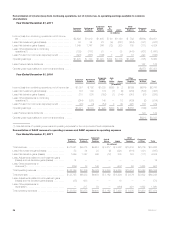
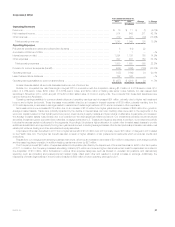
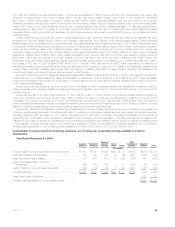
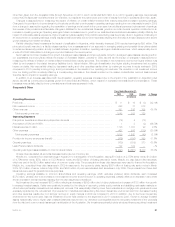
Reconciliation of income (loss) from continuing operations, net of income tax, to operating earnings available to common
shareholders
Year Ended December 31, 2010
Insurance
Products Retirement
Products
Corporate
Benefit
Funding Auto &
Home Japan
Other
International
Regions Corporate
& Other Total
(In millions)
Income (loss) from continuing operations, net of income tax ..... $1,367 $ 792 $1,020 $295 $ 2 $(155) $(574) $2,747
Less: Net investment gains (losses) ........................ 103 139 176 (7) (9) (280) (530) (408)
Less: Net derivative gains (losses) ......................... 215 235 (162) (1) (144) (347) (61) (265)
Less: Other adjustments to continuing
operations(1) ........................................ (244) (381) 140 — 12 (439) (2) (914)
Less: Provision for income tax (expense) benefit .............. (28) (4) (54) 3 49 225 188 379
Operating earnings ..................................... $1,321 $ 803 $ 920 $300 $ 94 $ 686 (169) 3,955
Less: Preferred stock dividends ........................... 122 122
Operating earnings available to common shareholders ......... $(291) $3,833
MetLife, Inc. 29