MetLife 2011 Annual Report Download - page 25
Download and view the complete annual report
Please find page 25 of the 2011 MetLife annual report below. You can navigate through the pages in the report by either clicking on the pages listed below, or by using the keyword search tool below to find specific information within the annual report.-
 1
1 -
2
-
3
-
4
-
5
-
6
-
7
-
8
-
9
-
10
-
11
-
12
-
13
-
14
-
 15
15 -
 16
16 -
 17
17 -
 18
18 -
 19
19 -
 20
20 -
 21
21 -
 22
22 -
 23
23 -
 24
24 -
 25
25 -
 26
26 -
 27
27 -
 28
28 -
 29
29 -
 30
30 -
 31
31 -
 32
32 -
 33
33 -
 34
34 -
 35
35 -
36
-
37
-
38
-
39
-
40
-
41
-
42
-
43
-
44
-
45
-
46
-
47
-
48
-
49
-
50
-
51
-
52
-
53
-
54
-
55
-
56
-
57
-
58
-
59
-
60
-
61
-
62
-
63
-
64
-
65
-
66
-
67
-
68
-
69
-
70
-
71
-
72
-
73
-
74
-
75
-
76
-
77
-
78
-
79
-
80
-
81
-
82
-
83
-
84
-
85
-
86
-
87
-
88
-
89
-
90
-
91
-
92
-
93
-
94
-
95
-
96
-
97
-
98
-
99
-
100
-
101
-
102
-
103
-
104
-
105
-
106
-
107
-
108
-
109
-
110
-
111
-
112
-
113
-
114
-
115
-
116
-
117
-
118
-
119
-
120
-
121
-
122
-
123
-
124
-
125
-
126
-
127
-
128
-
129
-
130
-
131
-
132
-
133
-
134
-
135
-
136
-
137
-
138
-
139
-
140
-
141
-
142
-
143
-
144
-
145
-
146
-
147
-
148
-
149
-
150
-
151
-
152
-
153
-
154
-
155
-
156
-
157
-
158
-
159
-
160
-
161
-
162
-
163
-
164
-
165
-
166
-
167
-
168
-
169
-
170
-
171
-
172
-
173
-
174
-
175
-
176
-
177
-
178
-
179
-
180
-
181
-
182
-
183
-
184
-
185
-
186
-
187
-
188
-
189
-
190
-
191
-
192
-
193
-
194
-
195
-
196
-
197
-
198
-
199
-
200
-
201
-
202
-
203
-
204
-
205
-
206
-
207
-
208
-
209
-
210
-
211
-
212
-
213
-
214
-
215
-
216
-
217
-
218
-
219
-
220
-
221
-
222
-
223
-
224
-
225
-
226
-
227
-
228
-
229
-
230
-
231
-
232
-
233
-
234
-
235
-
236
-
237
-
238
-
239
-
240
-
241
-
242
-
243
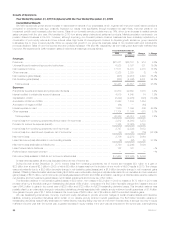
 |
 |

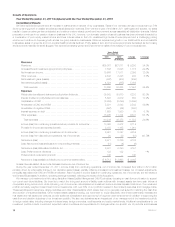
Year Ended December 31, 2010
Insurance
Products Retirement
Products
Corporate
Benefit
Funding Auto &
Home Japan
Other
International
Regions Corporate
& Other Total
(In millions)
Total revenues ................................ $ 26,444 $6,849 $7,568 $ 3,146 $ 669 $5,685 $1,904 $ 52,265
Less: Net investment gains (losses) ............... 103 139 176 (7) (9) (280) (530) (408)
Less: Net derivative gains (losses) ................. 215 235 (162) (1) (144) (347) (61) (265)
Less: Adjustments related to net investment gains
(losses) and net derivative gains (losses) .......... 1 — — — — — — 1
Less: Other adjustments to
revenues(1) ................................ (151) (39) 190 — 116 (72) 1,450 1,494
Total operating revenues ........................ $ 26,276 $6,514 $7,364 $ 3,154 $ 706 $6,384 $1,045 $ 51,443
Total expenses ............................... $ 24,338 $5,622 $5,999 $ 2,781 $ 664 $5,917 $3,032 $ 48,353
Less: Adjustments related to net investment gains
(losses) and net derivative gains (losses) .......... 90 35 — — — — — 125
Less: Other adjustments to
expenses(1) ................................ 4 307 50 — 104 367 1,452 2,284
Total operating expenses ....................... $ 24,244 $5,280 $5,949 $ 2,781 $ 560 $5,550 $1,580 $ 45,944
(1) See definitions of operating revenues and operating expenses for the components of such adjustments.
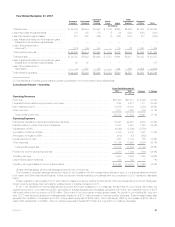
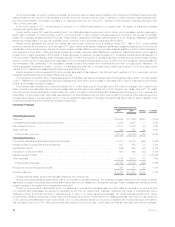
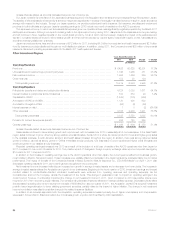
Consolidated Results – Operating
Years Ended December 31,
Change % Change2011 2010
(In millions)
Operating Revenues
Premiums ........................................................................ $36,269 $27,071 $ 9,198 34.0%
Universal life and investment-type product policy fees ...................................... 7,528 5,817 1,711 29.4%
Net investment income .............................................................. 19,676 16,880 2,796 16.6%
Other revenues .................................................................... 1,911 1,675 236 14.1%
Total operating revenues ........................................................... 65,384 51,443 13,941 27.1%
Operating Expenses
Policyholder benefits and claims and policyholder dividends ................................. 36,227 29,972 6,255 20.9%
Interest credited to policyholder account balances ......................................... 6,057 4,697 1,360 29.0%
Capitalization of DAC ............................................................... (6,849) (3,299) (3,550)
Amortization of DAC and VOBA ....................................................... 4,799 2,802 1,997 71.3%
Amortization of negative VOBA ........................................................ (619) (57) (562)
Interest expense on debt ............................................................ 1,305 1,139 166 14.6%
Other expenses ................................................................... 16,754 10,690 6,064 56.7%
Total operating expenses .......................................................... 57,674 45,944 11,730 25.5%
Provision for income tax expense (benefit) ............................................... 2,230 1,544 686 44.4%
Operating earnings ................................................................. 5,480 3,955 1,525 38.6%
Less: Preferred stock dividends ....................................................... 122 122 — —%
Operating earnings available to common shareholders ..................................... $ 5,358 $ 3,833 $ 1,525 39.8%
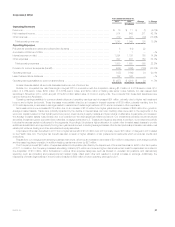
Unless otherwise stated, all amounts discussed below are net of income tax.
The increase in operating earnings reflects the impact of the Acquisition with the corresponding effects on each of our financial statement lines in
both Japan and Other International Regions. Further trends and matters impacting our business and the comparison to 2010 results are discussed
below.
Positive results from strong sales in 2011 were offset by losses from severe weather and the impact of the low interest rate environment. Changes in
foreign currency exchange rates had a slightly positive impact on results compared to 2010.
In 2011, we benefited from strong sales as well as growth and higher persistency in our business, across many of our products. As a result, we
experienced growth in our investment portfolio, as well as our average separate account assets, generating both higher net investment income of $479
million and higher policy fee income of $265 million. Since many of our products are interest spread-based, the growth in our individual life, long-term
care (“LTC”) and structured settlement businesses also resulted in a $131 million increase in interest credited expenses. These increased sales also
generated an increase in commission and other volume-related expenses of $622 million, which was largely offset by an increase of $538 million in
related DAC capitalization. In addition, other non-variable expenses increased $73 million due to growth in our existing businesses.
MetLife, Inc. 21