MetLife 2011 Annual Report Download - page 48
Download and view the complete annual report
Please find page 48 of the 2011 MetLife annual report below. You can navigate through the pages in the report by either clicking on the pages listed below, or by using the keyword search tool below to find specific information within the annual report.-
 1
1 -
2
-
3
-
4
-
5
-
6
-
7
-
8
-
9
-
10
-
11
-
12
-
13
-
14
-
15
-
16
-
17
-
18
-
19
-
20
-
21
-
22
-
23
-
24
-
25
-
26
-
27
-
28
-
29
-
30
-
31
-
32
-
33
-
34
-
35
-
36
-
37
-
 38
38 -
 39
39 -
 40
40 -
 41
41 -
 42
42 -
 43
43 -
 44
44 -
 45
45 -
 46
46 -
 47
47 -
 48
48 -
 49
49 -
 50
50 -
 51
51 -
 52
52 -
 53
53 -
 54
54 -
 55
55 -
 56
56 -
 57
57 -
 58
58 -
59
-
60
-
61
-
62
-
63
-
64
-
65
-
66
-
67
-
68
-
69
-
70
-
71
-
72
-
73
-
74
-
75
-
76
-
77
-
78
-
79
-
80
-
81
-
82
-
83
-
84
-
85
-
86
-
87
-
88
-
89
-
90
-
91
-
92
-
93
-
94
-
95
-
96
-
97
-
98
-
99
-
100
-
101
-
102
-
103
-
104
-
105
-
106
-
107
-
108
-
109
-
110
-
111
-
112
-
113
-
114
-
115
-
116
-
117
-
118
-
119
-
120
-
121
-
122
-
123
-
124
-
125
-
126
-
127
-
128
-
129
-
130
-
131
-
132
-
133
-
134
-
135
-
136
-
137
-
138
-
139
-
140
-
141
-
142
-
143
-
144
-
145
-
146
-
147
-
148
-
149
-
150
-
151
-
152
-
153
-
154
-
155
-
156
-
157
-
158
-
159
-
160
-
161
-
162
-
163
-
164
-
165
-
166
-
167
-
168
-
169
-
170
-
171
-
172
-
173
-
174
-
175
-
176
-
177
-
178
-
179
-
180
-
181
-
182
-
183
-
184
-
185
-
186
-
187
-
188
-
189
-
190
-
191
-
192
-
193
-
194
-
195
-
196
-
197
-
198
-
199
-
200
-
201
-
202
-
203
-
204
-
205
-
206
-
207
-
208
-
209
-
210
-
211
-
212
-
213
-
214
-
215
-
216
-
217
-
218
-
219
-
220
-
221
-
222
-
223
-
224
-
225
-
226
-
227
-
228
-
229
-
230
-
231
-
232
-
233
-
234
-
235
-
236
-
237
-
238
-
239
-
240
-
241
-
242
-
243
 |
 |

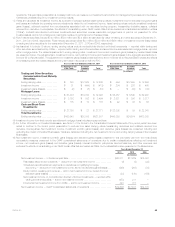
Years Ended December 31,
2011 2010 2009
(In millions)
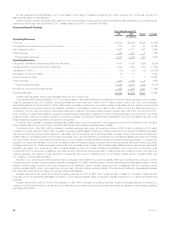
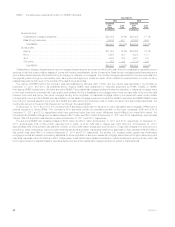
Investment portfolio gains (losses) — in the above yield table ............................ $ (553) $(193) $(3,037)
Real estate discontinued operations — deduct from net investment gains (losses) .......... (96) (14) (8)
Investment gains (losses) related to CSEs — add to net investment gains (losses) .......... 5 6 —
Other gains (losses) — add to net investment gains (losses) ........................... (223) (207) 144
Net investment gains (losses) — GAAP consolidated statements of operations .............. $ (867) $(408) $(2,901)
Derivative gains (losses) — in the above yield table .................................... $4,545 $(614) $(5,106)
Scheduled periodic settlement payments on derivatives not qualifying for hedge
accounting — add to net derivative gains (losses), deduct from net investment income .... 249 208 88
Scheduled periodic settlement payments on derivatives not qualifying for hedge
accounting — add to net derivative gains (losses), deduct from interest credited to PABs . . 19 11 (4)
Settlement of foreign currency earnings hedges — add to net derivative gains (losses), deduct
from other revenues ........................................................ (12) — —
Equity method operating joint ventures — add to net investment income, deduct from net
derivative gains (losses) ..................................................... 23 130 156
Net derivative gains (losses) — GAAP consolidated statements of operations ............... $4,824 $(265) $(4,866)
See “— Results of Operations — Year Ended December 31, 2011 Compared with the Year Ended December 31, 2010” and “— Year Ended
December 31, 2010 Compared with the Year Ended December 31, 2009,” for analyses of the year over year changes in net investment income, net
investment gains (losses) and net derivative gains (losses).
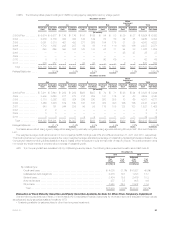
Fixed Maturity and Equity Securities Available-for-Sale
Fixed maturity securities, which consisted principally of publicly-traded and privately placed fixed maturity securities, were $350.3 billion and
$324.8 billion at estimated fair value, or 67% and 69% of total cash and invested assets, at December 31, 2011 and 2010, respectively. Publicly-traded
fixed maturity securities represented $303.6 billion and $284.0 billion of total fixed maturity securities at estimated fair value, at December 31, 2011 and
2010, respectively, or 87% of total fixed maturity securities at estimated fair value, at both December 31, 2011 and 2010. Privately placed fixed maturity
securities represented $46.7 billion and $40.8 billion at estimated fair value, at December 31, 2011 and 2010 respectively, or 13% of total fixed maturity
securities at estimated fair value, at both December 31, 2011 and 2010.
Equity securities, which consisted principally of publicly-traded and privately-held common and preferred stocks, including certain perpetual hybrid
securities and mutual fund interests, were $3.0 billion and $3.6 billion at estimated fair value, or 0.6% and 0.8% of total cash and invested assets, at
December 31, 2011 and 2010, respectively. Publicly-traded equity securities represented $1.7 billion and $2.3 billion at estimated fair value, or 57%
and 64% of total equity securities, at December 31, 2011 and 2010, respectively. Privately-held equity securities represented $1.3 billion of total equity
securities at estimated fair value, at both December 31, 2011 and 2010, or 43% and 36% of total equity securities at estimated fair value, at
December 31, 2011 and 2010, respectively.
Upon acquisition, the Company classifies perpetual securities that have attributes of both debt and equity as fixed maturity securities if the securities
have an interest rate step-up feature which, when combined with other qualitative factors, indicates that the securities have more debt-like
characteristics; while those with more equity-like characteristics are classified as equity securities within non-redeemable preferred stock. Many of such
securities, commonly referred to as “perpetual hybrid securities,” have been issued by non-U.S. financial institutions that are accorded the highest two
capital treatment categories by their respective regulatory bodies (i.e. core capital, or “Tier 1 capital” and perpetual deferrable securities, or “Upper Tier 2
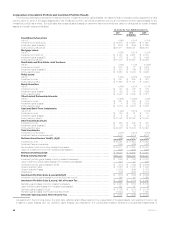
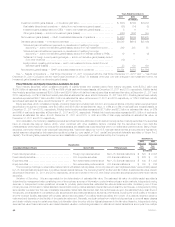
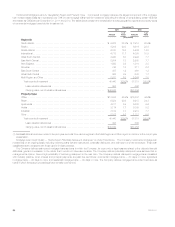
capital”). The following table presents the amount and classification of perpetual hybrid securities held by the Company at:
December 31,
2011 2010
Classification Estimated
Fair
Value
Estimated
Fair
ValueConsolidated Balance Sheets Sector Table Primary Issuers
(In millions)
Fixed maturity securities ............................. Foreign corporate securities Non-U.S. financial institutions $ 523 $ 2,008
Fixed maturity securities ............................. U.S. corporate securities U.S. financial institutions $ 226 $ 83
Equity securities ................................... Non-redeemable preferred stock Non-U.S. financial institutions $ 440 $ 1,043
Equity securities ................................... Non-redeemable preferred stock U.S. financial institutions $ 350 $ 236
The Company’s holdings in redeemable preferred stock with stated maturity dates, commonly referred to as “capital securities,” were primarily issued
by U.S. financial institutions and have cumulative interest deferral features. The Company held $1.9 billion and $2.7 billion at estimated fair value of such
securities at December 31, 2011 and 2010, respectively, which are included in the U.S. and foreign corporate securities sectors within fixed maturity
securities.
Valuation of Securities. We are responsible for the determination of estimated fair value. The estimated fair value of publicly-traded securities is
determined by management after considering one of three primary sources of information: quoted market prices in active markets, independent pricing
services, or independent broker quotations; whereas for privately placed securities, estimated fair value is determined after considering one of three
primary sources of information: market standard internal matrix pricing, market standard internal discounted cash flow techniques, or independent pricing
services after we determine their use of available observable market data. Discounted cash flow techniques rely upon the estimated future cash flows of
the security, credit spreads of comparable public securities and secondary transactions, as well as other factors, including the credit quality of the issuer
and the reduced liquidity associated with privately placed debt securities. For publicly-traded securities, the number of quotations obtained varies by
instrument and depends on the liquidity of the particular instrument. Generally, we obtain prices from multiple pricing services to cover all asset classes
and obtain multiple prices for certain securities, but ultimately utilize the price with the highest placement in the fair value hierarchy. Independent pricing
services that value these instruments use market standard valuation methodologies based on data about market transactions and inputs from multiple
44 MetLife, Inc.