MetLife 2011 Annual Report Download - page 139
Download and view the complete annual report
Please find page 139 of the 2011 MetLife annual report below. You can navigate through the pages in the report by either clicking on the pages listed below, or by using the keyword search tool below to find specific information within the annual report.-
 1
1 -
2
-
3
-
4
-
5
-
6
-
7
-
8
-
9
-
10
-
11
-
12
-
13
-
14
-
15
-
16
-
17
-
18
-
19
-
20
-
21
-
22
-
23
-
24
-
25
-
26
-
27
-
28
-
29
-
30
-
31
-
32
-
33
-
34
-
35
-
36
-
37
-
38
-
39
-
40
-
41
-
42
-
43
-
44
-
45
-
46
-
47
-
48
-
49
-
50
-
51
-
52
-
53
-
54
-
55
-
56
-
57
-
58
-
59
-
60
-
61
-
62
-
63
-
64
-
65
-
66
-
67
-
68
-
69
-
70
-
71
-
72
-
73
-
74
-
75
-
76
-
77
-
78
-
79
-
80
-
81
-
82
-
83
-
84
-
85
-
86
-
87
-
88
-
89
-
90
-
91
-
92
-
93
-
94
-
95
-
96
-
97
-
98
-
99
-
100
-
101
-
102
-
103
-
104
-
105
-
106
-
107
-
108
-
109
-
110
-
111
-
112
-
113
-
114
-
115
-
116
-
117
-
118
-
119
-
120
-
121
-
122
-
123
-
124
-
125
-
126
-
127
-
128
-
 129
129 -
 130
130 -
 131
131 -
 132
132 -
 133
133 -
 134
134 -
 135
135 -
 136
136 -
 137
137 -
 138
138 -
 139
139 -
 140
140 -
 141
141 -
 142
142 -
 143
143 -
 144
144 -
 145
145 -
 146
146 -
 147
147 -
 148
148 -
 149
149 -
150
-
151
-
152
-
153
-
154
-
155
-
156
-
157
-
158
-
159
-
160
-
161
-
162
-
163
-
164
-
165
-
166
-
167
-
168
-
169
-
170
-
171
-
172
-
173
-
174
-
175
-
176
-
177
-
178
-
179
-
180
-
181
-
182
-
183
-
184
-
185
-
186
-
187
-
188
-
189
-
190
-
191
-
192
-
193
-
194
-
195
-
196
-
197
-
198
-
199
-
200
-
201
-
202
-
203
-
204
-
205
-
206
-
207
-
208
-
209
-
210
-
211
-
212
-
213
-
214
-
215
-
216
-
217
-
218
-
219
-
220
-
221
-
222
-
223
-
224
-
225
-
226
-
227
-
228
-
229
-
230
-
231
-
232
-
233
-
234
-
235
-
236
-
237
-
238
-
239
-
240
-
241
-
242
-
243
 |
 |

MetLife, Inc.
Notes to the Consolidated Financial Statements — (Continued)
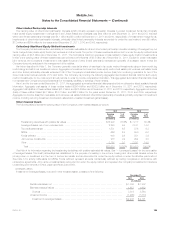
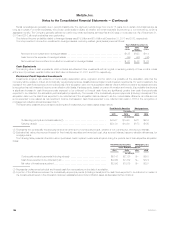
Other Limited Partnership Interests
The carrying value of other limited partnership interests (which primarily represent ownership interests in pooled investment funds that principally
make private equity investments in companies in the United States and overseas) was $6.4 billion at both December 31, 2011 and 2010. Included
within other limited partnership interests were $1.1 billion and $1.0 billion at December 31, 2011 and 2010, respectively, of investments in hedge funds.
Impairments of other limited partnership interests, principally other limited partnership interests accounted for under the cost method, were $5 million,
$12 million and $354 million for the years ended December 31, 2011, 2010 and 2009, respectively.
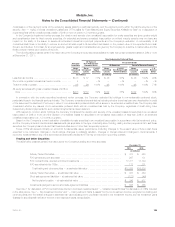
Collectively Significant Equity Method Investments
The Company holds investments in real estate joint ventures, real estate funds and other limited partnership interests consisting of leveraged buy-out
funds, hedge funds, private equity funds, joint ventures and other funds. The portion of these investments accounted for under the equity method had a
carrying value of $9.5 billion as of December 31, 2011. The Company’s maximum exposure to loss related to these equity method investments is
limited to the carrying value of these investments plus unfunded commitments of $3.5 billion as of December 31, 2011. Except for certain real estate
joint ventures, the Company’s investments in real estate funds and other limited partnership interests are generally of a passive nature in that the
Company does not participate in the management of the entities.
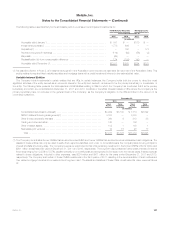
As further described in Note 1, the Company generally records its share of earnings in its equity method investments using a three-month lag
methodology and within net investment income. Aggregate net investment income from these equity method real estate joint ventures, real estate funds
and other limited partnership interests exceeded 10% of the Company’s consolidated pre-tax income (loss) from continuing operations for two of the
three most recent annual periods: 2010 and 2009. The Company is providing the following aggregated summarized financial data for such equity
method investments, for the most recent annual periods, in order to provide comparative information. This aggregated summarized financial data does
not represent the Company’s proportionate share of the assets, liabilities, or earnings of such entities.
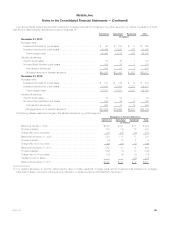
As of, and for the year ended December 31, 2011, the aggregated summarized financial data presented below reflects the latest available financial
information. Aggregate total assets of these entities totaled $266.4 billion and $262.9 billion as of December 31, 2011 and 2010, respectively.
Aggregate total liabilities of these entities totaled $31.2 billion and $77.6 billion as of December 31, 2011 and 2010, respectively. Aggregate net income
(loss) of these entities totaled $9.7 billion, $18.7 billion and $22.8 billion for the years ended December 31, 2011, 2010 and 2009, respectively.
Aggregate net income (loss) from real estate joint ventures, real estate funds and other limited partnership interests is primarily comprised of investment
income, including recurring investment income and realized and unrealized investment gains (losses).
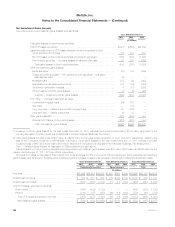
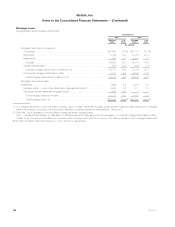
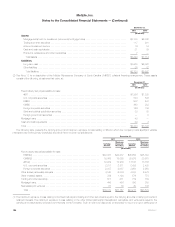
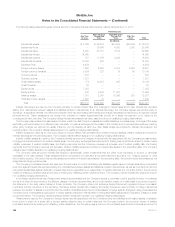
Other Invested Assets
The following table presents the carrying value of the Company’s other invested assets by type at:
December 31,
2011 2010
Carrying
Value %of
Total Carrying
Value %of
Total
(In millions) (In millions)
Freestanding derivatives with positive fair values ............................. $16,200 68.6% $ 7,777 50.4%
Leveraged leases, net of non-recourse debt ................................ 2,248 9.5 2,191 14.2
Tax credit partnerships ................................................ 1,531 6.5 976 6.3
MSRs .............................................................. 666 2.8 950 6.2
Funds withheld ...................................................... 608 2.6 551 3.6
Joint venture investments .............................................. 218 0.9 694 4.5
Other .............................................................. 2,157 9.1 2,291 14.8
Total ............................................................. $23,628 100.0% $15,430 100.0%
See Note 4 for information regarding the freestanding derivatives with positive estimated fair values. See “— Leveraged Leases” for the composition
of leveraged leases. Tax credit partnerships are established for the purpose of investing in low-income housing and other social causes, where the
primary return on investment is in the form of income tax credits, and are accounted for under the equity method or under the effective yield method.
See Note 5 for activity rollforwards for MSRs. Funds withheld represent amounts contractually withheld by ceding companies in accordance with
reinsurance agreements. Joint venture investments are accounted for under the equity method and represent the Company’s investment in insurance
underwriting joint ventures in China, Japan (see Note 2) and Chile.
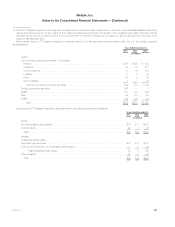
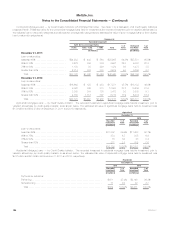
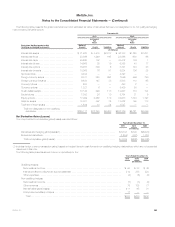
Leveraged Leases
Investment in leveraged leases, included in other invested assets, consisted of the following:
December 31,
2011 2010
(In millions)
Rental receivables, net .......................................................... $1,859 $ 1,882
Estimated residual values ........................................................ 1,657 1,682
Subtotal .................................................................... 3,516 3,564
Unearned income .............................................................. (1,268) (1,373)
Investment in leveraged leases .................................................. $2,248 $ 2,191
MetLife, Inc. 135