MetLife 2011 Annual Report Download - page 17
Download and view the complete annual report
Please find page 17 of the 2011 MetLife annual report below. You can navigate through the pages in the report by either clicking on the pages listed below, or by using the keyword search tool below to find specific information within the annual report.-
 1
1 -
2
-
3
-
4
-
5
-
6
-
 7
7 -
 8
8 -
 9
9 -
 10
10 -
 11
11 -
 12
12 -
 13
13 -
 14
14 -
 15
15 -
 16
16 -
 17
17 -
 18
18 -
 19
19 -
 20
20 -
 21
21 -
 22
22 -
 23
23 -
 24
24 -
 25
25 -
 26
26 -
 27
27 -
28
-
29
-
30
-
31
-
32
-
33
-
34
-
35
-
36
-
37
-
38
-
39
-
40
-
41
-
42
-
43
-
44
-
45
-
46
-
47
-
48
-
49
-
50
-
51
-
52
-
53
-
54
-
55
-
56
-
57
-
58
-
59
-
60
-
61
-
62
-
63
-
64
-
65
-
66
-
67
-
68
-
69
-
70
-
71
-
72
-
73
-
74
-
75
-
76
-
77
-
78
-
79
-
80
-
81
-
82
-
83
-
84
-
85
-
86
-
87
-
88
-
89
-
90
-
91
-
92
-
93
-
94
-
95
-
96
-
97
-
98
-
99
-
100
-
101
-
102
-
103
-
104
-
105
-
106
-
107
-
108
-
109
-
110
-
111
-
112
-
113
-
114
-
115
-
116
-
117
-
118
-
119
-
120
-
121
-
122
-
123
-
124
-
125
-
126
-
127
-
128
-
129
-
130
-
131
-
132
-
133
-
134
-
135
-
136
-
137
-
138
-
139
-
140
-
141
-
142
-
143
-
144
-
145
-
146
-
147
-
148
-
149
-
150
-
151
-
152
-
153
-
154
-
155
-
156
-
157
-
158
-
159
-
160
-
161
-
162
-
163
-
164
-
165
-
166
-
167
-
168
-
169
-
170
-
171
-
172
-
173
-
174
-
175
-
176
-
177
-
178
-
179
-
180
-
181
-
182
-
183
-
184
-
185
-
186
-
187
-
188
-
189
-
190
-
191
-
192
-
193
-
194
-
195
-
196
-
197
-
198
-
199
-
200
-
201
-
202
-
203
-
204
-
205
-
206
-
207
-
208
-
209
-
210
-
211
-
212
-
213
-
214
-
215
-
216
-
217
-
218
-
219
-
220
-
221
-
222
-
223
-
224
-
225
-
226
-
227
-
228
-
229
-
230
-
231
-
232
-
233
-
234
-
235
-
236
-
237
-
238
-
239
-
240
-
241
-
242
-
243
 |
 |

The determination of the amount of allowances and impairments on other invested asset classes is highly subjective and is based upon the
Company’s periodic evaluation and assessment of known and inherent risks associated with the respective asset class. Such evaluations and
assessments are revised as conditions change and new information becomes available.
See Note 3 of the Notes to the Consolidated Financial Statements for additional information relating to investment impairments.
Derivative Financial Instruments
The determination of estimated fair value of freestanding derivatives, when quoted market values are not available, is based on market standard
valuation methodologies and inputs that management believes are consistent with what other market participants would use when pricing the
instruments. Derivative valuations can be affected by changes in interest rates, foreign currency exchange rates, financial indices, credit spreads, default
risk, nonperformance risk, volatility, liquidity and changes in estimates and assumptions used in the pricing models. See Note 5 of the Notes to the
Consolidated Financial Statements for additional details on significant inputs into the OTC derivative pricing models and credit risk adjustment.
The Company issues certain variable annuity products with guaranteed minimum benefits, which are measured at estimated fair value separately
from the host variable annuity product, with changes in estimated fair value reported in net derivative gains (losses). The estimated fair values of these
embedded derivatives are determined based on the present value of projected future benefits minus the present value of projected future fees. The
projections of future benefits and future fees require capital market and actuarial assumptions including expectations concerning policyholder behavior.
A risk neutral valuation methodology is used under which the cash flows from the guarantees are projected under multiple capital market scenarios
using observable risk free rates. The valuation of these embedded derivatives also includes an adjustment for the Company’s nonperformance risk and
risk margins for non-capital market inputs. The nonperformance risk adjustment, which is captured as a spread over the risk free rate in determining the
discount rate to discount the cash flows of the liability, is determined by taking into consideration publicly available information relating to spreads in the
secondary market for MetLife, Inc.’s debt, including related credit default swaps. These observable spreads are then adjusted, as necessary, to reflect
the priority of these liabilities and the claims paying ability of the issuing insurance subsidiaries compared to MetLife, Inc. Risk margins are established to
capture the non-capital market risks of the instrument which represent the additional compensation a market participant would require to assume the
risks related to the uncertainties in certain actuarial assumptions. The establishment of risk margins requires the use of significant management
judgment, including assumptions of the amount and cost of capital needed to cover the guarantees.
As part of its regular review of critical accounting estimates, the Company periodically assesses inputs for estimating nonperformance risk in fair
value measurements. During the second quarter of 2010, the Company completed a study that aggregated and evaluated data, including historical
recovery rates of insurance companies, as well as policyholder behavior observed during the recent financial crisis. As a result, at the end of the second
quarter of 2010, the Company refined the manner in which its insurance subsidiaries incorporate expected recovery rates into the nonperformance risk
adjustment for purposes of estimating the fair value of investment-type contracts and embedded derivatives within insurance contracts. The refinement
impacted the Company’s income from continuing operations, net of income tax, with no effect on operating earnings.
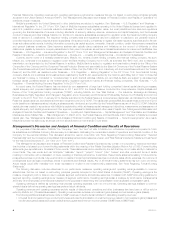
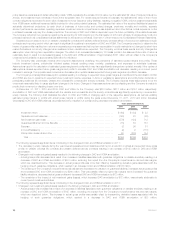
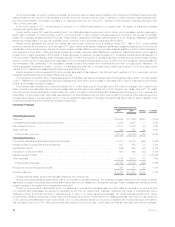
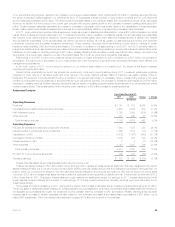
The table below illustrates the impact that a range of reasonably likely variances in credit spreads would have on the Company’s consolidated
balance sheet, excluding the effect of income tax. However, these estimated effects do not take into account potential changes in other variables, such
as equity price levels and market volatility, that can also contribute significantly to changes in carrying values. Therefore, the table does not necessarily
reflect the ultimate impact on the consolidated financial statements under the credit spread variance scenarios presented below.
In determining the ranges, the Company has considered current market conditions, as well as the market level of spreads that can reasonably be
anticipated over the near term. The ranges do not reflect extreme market conditions experienced during the recent financial crisis as the Company does
not consider those to be reasonably likely events in the near future.
Carrying Value
At December 31, 2011
PABs DAC and
VOBA
(In millions)
100% increase in the Company’s credit spread .................................................. $2,449 $ 700
As reported ............................................................................. $4,176 $ 958
50% decrease in the Company’s credit spread .................................................. $5,479 $1,110
The accounting for derivatives is complex and interpretations of accounting standards continue to evolve in practice. If it is determined that hedge
accounting designations were not appropriately applied, reported net income could be materially affected. Differences in judgment as to the availability
and application of hedge accounting designations and the appropriate accounting treatment may result in a differing impact on the consolidated financial
statements of the Company from that previously reported. Assessments of hedge effectiveness and measurements of ineffectiveness of hedging
relationships are also subject to interpretations and estimations and different interpretations or estimates may have a material effect on the amount
reported in net income.
Variable annuities with guaranteed minimum benefits may be more costly than expected in volatile or declining equity markets. Market conditions
including, but not limited to, changes in interest rates, equity indices, market volatility and foreign currency exchange rates, changes in the Company’s
nonperformance risk, variations in actuarial assumptions regarding policyholder behavior, mortality and risk margins related to non-capital market inputs,
may result in significant fluctuations in the estimated fair value of the guarantees that could materially affect net income. If interpretations change, there is
a risk that features previously not bifurcated may require bifurcation and reporting at estimated fair value in the consolidated financial statements and
respective changes in estimated fair value could materially affect net income.
Additionally, the Company ceded the risk associated with certain of the variable annuities with guaranteed minimum benefits described in the
preceding paragraphs. The value of the embedded derivatives on the ceded risk is determined using a methodology consistent with that described
previously for the guarantees directly written by the Company with the exception of the input for nonperformance risk that reflects the credit of the
reinsurer. Because certain of the direct guarantees do not meet the definition of an embedded derivative and, thus are not accounted for at fair value,
significant fluctuations in net income may occur since the change in fair value of the embedded derivative on the ceded risk is being recorded in net
income without a corresponding and offsetting change in fair value of the direct guarantee.
See Note 4 of the Notes to the Consolidated Financial Statements for additional information on the Company’s derivatives and hedging programs.
Deferred Policy Acquisition Costs and Value of Business Acquired
The Company incurs significant costs in connection with acquiring new and renewal insurance business. Costs that vary with and relate to the
production of new and renewal insurance business are deferred as DAC. Such costs consist principally of commissions, certain agency expenses,
MetLife, Inc. 13