MetLife 2011 Annual Report Download - page 7
Download and view the complete annual report
Please find page 7 of the 2011 MetLife annual report below. You can navigate through the pages in the report by either clicking on the pages listed below, or by using the keyword search tool below to find specific information within the annual report.-
 1
1 -
 2
2 -
 3
3 -
 4
4 -
 5
5 -
 6
6 -
 7
7 -
 8
8 -
 9
9 -
 10
10 -
 11
11 -
 12
12 -
 13
13 -
 14
14 -
 15
15 -
 16
16 -
 17
17 -
 18
18 -
19
-
20
-
21
-
22
-
23
-
24
-
25
-
26
-
27
-
28
-
29
-
30
-
31
-
32
-
33
-
34
-
35
-
36
-
37
-
38
-
39
-
40
-
41
-
42
-
43
-
44
-
45
-
46
-
47
-
48
-
49
-
50
-
51
-
52
-
53
-
54
-
55
-
56
-
57
-
58
-
59
-
60
-
61
-
62
-
63
-
64
-
65
-
66
-
67
-
68
-
69
-
70
-
71
-
72
-
73
-
74
-
75
-
76
-
77
-
78
-
79
-
80
-
81
-
82
-
83
-
84
-
85
-
86
-
87
-
88
-
89
-
90
-
91
-
92
-
93
-
94
-
95
-
96
-
97
-
98
-
99
-
100
-
101
-
102
-
103
-
104
-
105
-
106
-
107
-
108
-
109
-
110
-
111
-
112
-
113
-
114
-
115
-
116
-
117
-
118
-
119
-
120
-
121
-
122
-
123
-
124
-
125
-
126
-
127
-
128
-
129
-
130
-
131
-
132
-
133
-
134
-
135
-
136
-
137
-
138
-
139
-
140
-
141
-
142
-
143
-
144
-
145
-
146
-
147
-
148
-
149
-
150
-
151
-
152
-
153
-
154
-
155
-
156
-
157
-
158
-
159
-
160
-
161
-
162
-
163
-
164
-
165
-
166
-
167
-
168
-
169
-
170
-
171
-
172
-
173
-
174
-
175
-
176
-
177
-
178
-
179
-
180
-
181
-
182
-
183
-
184
-
185
-
186
-
187
-
188
-
189
-
190
-
191
-
192
-
193
-
194
-
195
-
196
-
197
-
198
-
199
-
200
-
201
-
202
-
203
-
204
-
205
-
206
-
207
-
208
-
209
-
210
-
211
-
212
-
213
-
214
-
215
-
216
-
217
-
218
-
219
-
220
-
221
-
222
-
223
-
224
-
225
-
226
-
227
-
228
-
229
-
230
-
231
-
232
-
233
-
234
-
235
-
236
-
237
-
238
-
239
-
240
-
241
-
242
-
243
 |
 |

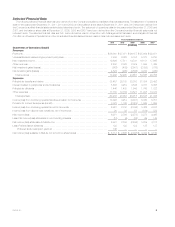
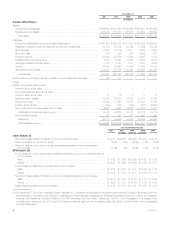
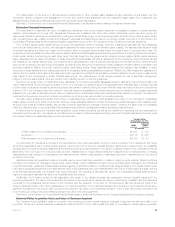
Selected Financial Data
The following selected financial data has been derived from the Company’s audited consolidated financial statements. The statement of operations
data for the years ended December 31, 2011, 2010 and 2009, and the balance sheet data at December 31, 2011 and 2010 have been derived from
the Company’s audited financial statements included elsewhere herein. The statement of operations data for the years ended December 31, 2008 and
2007, and the balance sheet data at December 31, 2009, 2008 and 2007 have been derived from the Company’s audited financial statements not
included herein. The selected financial data set forth below should be read in conjunction with “Management’s Discussion and Analysis of Financial
Condition and Results of Operations” and the consolidated financial statements and related notes included elsewhere herein.
Years Ended December 31,
2011 2010 2009 2008 2007
(In millions)
Statements of Operations Data(1)
Revenues
Premiums ...................................................................... $36,361 $ 27,071 $ 26,157 $ 25,604 $ 22,671
Universal life and investment-type product policy fees .................................... 7,806 6,028 5,197 5,373 5,233
Net investment income ............................................................ 19,606 17,511 14,741 16,181 17,965
Other revenues .................................................................. 2,532 2,328 2,329 1,585 1,465
Net investment gains (losses) ....................................................... (867) (408) (2,901) (2,085) (318)
Net derivative gains (losses) ........................................................ 4,824 (265) (4,866) 3,910 (260)
Total revenues ................................................................ 70,262 52,265 40,657 50,568 46,756
Expenses
Policyholder benefits and claims .................................................... 35,457 29,185 28,003 27,094 23,452
Interest credited to policyholder account balances ...................................... 5,603 4,919 4,845 4,787 5,458
Policyholder dividends ............................................................ 1,446 1,485 1,649 1,749 1,722
Other expenses ................................................................. 17,730 12,764 10,521 11,908 10,373
Total expenses ................................................................ 60,236 48,353 45,018 45,538 41,005
Income (loss) from continuing operations before provision for income tax ..................... 10,026 3,912 (4,361) 5,030 5,751
Provision for income tax expense (benefit) ............................................. 3,075 1,165 (2,025) 1,568 1,664
Income (loss) from continuing operations, net of income tax ............................... 6,951 2,747 (2,336) 3,462 4,087
Income (loss) from discontinued operations, net of income tax ............................. 20 39 58 (184) 378
Net income (loss) ................................................................ 6,971 2,786 (2,278) 3,278 4,465
Less: Net income (loss) attributable to noncontrolling interests ............................. (10) (4) (32) 69 148
Net income (loss) attributable to MetLife, Inc. ........................................... 6,981 2,790 (2,246) 3,209 4,317
Less: Preferred stock dividends ..................................................... 122 122 122 125 137
Preferred stock redemption premium ............................................. 146 ————
Net income (loss) available to MetLife, Inc.’s common shareholders ......................... $ 6,713 $ 2,668 $ (2,368) $ 3,084 $ 4,180
MetLife, Inc. 3