MetLife 2011 Annual Report Download - page 140
Download and view the complete annual report
Please find page 140 of the 2011 MetLife annual report below. You can navigate through the pages in the report by either clicking on the pages listed below, or by using the keyword search tool below to find specific information within the annual report.-
 1
1 -
2
-
3
-
4
-
5
-
6
-
7
-
8
-
9
-
10
-
11
-
12
-
13
-
14
-
15
-
16
-
17
-
18
-
19
-
20
-
21
-
22
-
23
-
24
-
25
-
26
-
27
-
28
-
29
-
30
-
31
-
32
-
33
-
34
-
35
-
36
-
37
-
38
-
39
-
40
-
41
-
42
-
43
-
44
-
45
-
46
-
47
-
48
-
49
-
50
-
51
-
52
-
53
-
54
-
55
-
56
-
57
-
58
-
59
-
60
-
61
-
62
-
63
-
64
-
65
-
66
-
67
-
68
-
69
-
70
-
71
-
72
-
73
-
74
-
75
-
76
-
77
-
78
-
79
-
80
-
81
-
82
-
83
-
84
-
85
-
86
-
87
-
88
-
89
-
90
-
91
-
92
-
93
-
94
-
95
-
96
-
97
-
98
-
99
-
100
-
101
-
102
-
103
-
104
-
105
-
106
-
107
-
108
-
109
-
110
-
111
-
112
-
113
-
114
-
115
-
116
-
117
-
118
-
119
-
120
-
121
-
122
-
123
-
124
-
125
-
126
-
127
-
128
-
129
-
 130
130 -
 131
131 -
 132
132 -
 133
133 -
 134
134 -
 135
135 -
 136
136 -
 137
137 -
 138
138 -
 139
139 -
 140
140 -
 141
141 -
 142
142 -
 143
143 -
 144
144 -
 145
145 -
 146
146 -
 147
147 -
 148
148 -
 149
149 -
 150
150 -
151
-
152
-
153
-
154
-
155
-
156
-
157
-
158
-
159
-
160
-
161
-
162
-
163
-
164
-
165
-
166
-
167
-
168
-
169
-
170
-
171
-
172
-
173
-
174
-
175
-
176
-
177
-
178
-
179
-
180
-
181
-
182
-
183
-
184
-
185
-
186
-
187
-
188
-
189
-
190
-
191
-
192
-
193
-
194
-
195
-
196
-
197
-
198
-
199
-
200
-
201
-
202
-
203
-
204
-
205
-
206
-
207
-
208
-
209
-
210
-
211
-
212
-
213
-
214
-
215
-
216
-
217
-
218
-
219
-
220
-
221
-
222
-
223
-
224
-
225
-
226
-
227
-
228
-
229
-
230
-
231
-
232
-
233
-
234
-
235
-
236
-
237
-
238
-
239
-
240
-
241
-
242
-
243
 |
 |

MetLife, Inc.
Notes to the Consolidated Financial Statements — (Continued)
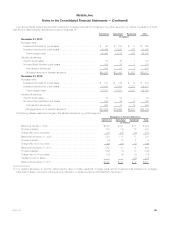
Rental receivables are generally due in periodic installments. The payment periods range from one to 15 years, but in certain circumstances are as
long as 34 years. For rental receivables, the primary credit quality indicator is whether the rental receivable is performing or non-performing, which is
assessed monthly. The Company generally defines non-performing rental receivables as those that are 90 days or more past due. As of December 31,
2011 and 2010, all rental receivables were performing.
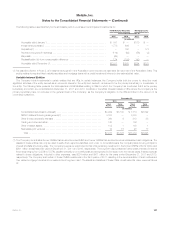
The deferred income tax liability related to leveraged leases was $1.5 billion and $1.4 billion at December 31, 2011 and 2010, respectively.
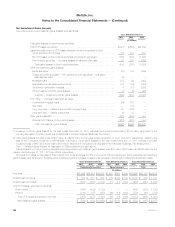
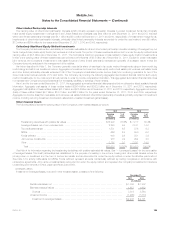
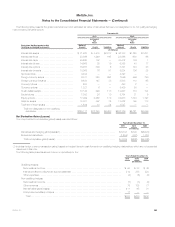
The components of income from investment in leveraged leases, excluding realized gains (losses) were as follows:
Years Ended December 31,
2011 2010 2009
(In millions)
Net income from investment in leveraged leases ............................................ $125 $123 $114
Less: Income tax expense on leveraged leases ............................................. (44) (43) (40)
Net investment income after income tax from investment in leveraged leases ...................... $ 81 $ 80 $ 74
Cash Equivalents
The carrying value of cash equivalents, which includes securities and other investments with an original or remaining maturity of three months or less
at the time of purchase, was $5.0 billion and $9.6 billion at December 31, 2011 and 2010, respectively.
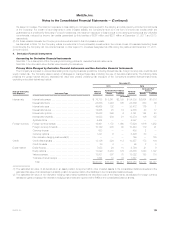
Purchased Credit Impaired Investments
Investments acquired with evidence of credit quality deterioration since origination and for which it is probable at the acquisition date that the
Company will be unable to collect all contractually required payments are classified as purchased credit impaired investments. For each investment, the
excess of the cash flows expected to be collected as of the acquisition date over its acquisition-date fair value is referred to as the accretable yield and
is recognized as net investment income on an effective yield basis. If subsequently, based on current information and events, it is probable that thereis
a significant increase in cash flows previously expected to be collected or if actual cash flows are significantly greater than cash flows previously
expected to be collected, the accretable yield is adjusted prospectively. The excess of the contractually required payments (including interest) as of the
acquisition date over the cash flows expected to be collected as of the acquisition date is referred to as the nonaccretable difference, and this amount
is not expected to be realized as net investment income. Decreases in cash flows expected to be collected can result in OTTI or the recognition of
mortgage loan valuation allowances (see Note 1).
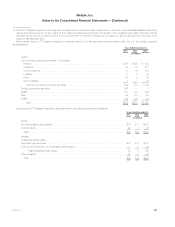
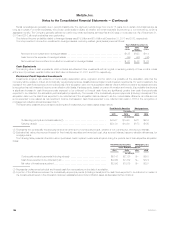
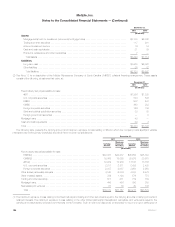
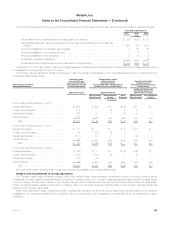
The table below presents the purchased credit impaired investments, by invested asset class, held at:
Fixed Maturity Securities Mortgage Loans
December 31,
2011 2010 2011 2010
(In millions)
Outstanding principal and interest balance(1) .................................. $4,547 $1,548 $471 $504
Carrying value(2) ........................................................ $3,130 $1,050 $173 $195
(1) Represents the contractually required payments which is the sum of contractual principal, whether or not currently due, and accrued interest.
(2) Estimated fair value plus accrued interest for fixed maturity securities and amortized cost, plus accrued interest, less any valuation allowances, for
mortgage loans.
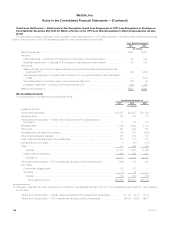
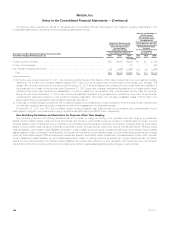
The following table presents information about purchased credit impaired investments acquired during the periods, as of their respective acquisition
dates:
Fixed Maturity Securities Mortgage Loans
Years Ended December 31,
2011 2010 2011 2010
(In millions)
Contractually required payments (including interest) .............................. $5,141 $2,126 $— $553
Cash flows expected to be collected(1),(2) ..................................... $4,365 $1,782 $— $374
Fair value of investments acquired ............................................ $2,590 $1,076 $— $201
(1) Represents undiscounted principal and interest cash flow expectations, at the date of acquisition.
(2) A portion of the difference between the contractually required payments (including interest) and the cash flows expected to be collected on certain of
the investments acquired in the Acquisition has been established as an indemnification asset as discussed further in Note 2.
136 MetLife, Inc.