MetLife 2011 Annual Report Download - page 31
Download and view the complete annual report
Please find page 31 of the 2011 MetLife annual report below. You can navigate through the pages in the report by either clicking on the pages listed below, or by using the keyword search tool below to find specific information within the annual report.-
 1
1 -
2
-
3
-
4
-
5
-
6
-
7
-
8
-
9
-
10
-
11
-
12
-
13
-
14
-
15
-
16
-
17
-
18
-
19
-
20
-
 21
21 -
 22
22 -
 23
23 -
 24
24 -
 25
25 -
 26
26 -
 27
27 -
 28
28 -
 29
29 -
 30
30 -
 31
31 -
 32
32 -
 33
33 -
 34
34 -
 35
35 -
 36
36 -
 37
37 -
 38
38 -
 39
39 -
 40
40 -
 41
41 -
42
-
43
-
44
-
45
-
46
-
47
-
48
-
49
-
50
-
51
-
52
-
53
-
54
-
55
-
56
-
57
-
58
-
59
-
60
-
61
-
62
-
63
-
64
-
65
-
66
-
67
-
68
-
69
-
70
-
71
-
72
-
73
-
74
-
75
-
76
-
77
-
78
-
79
-
80
-
81
-
82
-
83
-
84
-
85
-
86
-
87
-
88
-
89
-
90
-
91
-
92
-
93
-
94
-
95
-
96
-
97
-
98
-
99
-
100
-
101
-
102
-
103
-
104
-
105
-
106
-
107
-
108
-
109
-
110
-
111
-
112
-
113
-
114
-
115
-
116
-
117
-
118
-
119
-
120
-
121
-
122
-
123
-
124
-
125
-
126
-
127
-
128
-
129
-
130
-
131
-
132
-
133
-
134
-
135
-
136
-
137
-
138
-
139
-
140
-
141
-
142
-
143
-
144
-
145
-
146
-
147
-
148
-
149
-
150
-
151
-
152
-
153
-
154
-
155
-
156
-
157
-
158
-
159
-
160
-
161
-
162
-
163
-
164
-
165
-
166
-
167
-
168
-
169
-
170
-
171
-
172
-
173
-
174
-
175
-
176
-
177
-
178
-
179
-
180
-
181
-
182
-
183
-
184
-
185
-
186
-
187
-
188
-
189
-
190
-
191
-
192
-
193
-
194
-
195
-
196
-
197
-
198
-
199
-
200
-
201
-
202
-
203
-
204
-
205
-
206
-
207
-
208
-
209
-
210
-
211
-
212
-
213
-
214
-
215
-
216
-
217
-
218
-
219
-
220
-
221
-
222
-
223
-
224
-
225
-
226
-
227
-
228
-
229
-
230
-
231
-
232
-
233
-
234
-
235
-
236
-
237
-
238
-
239
-
240
-
241
-
242
-
243
 |
 |

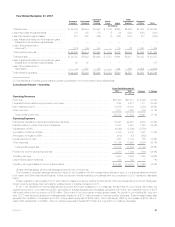
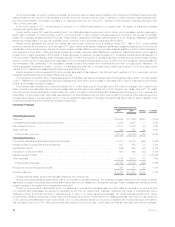
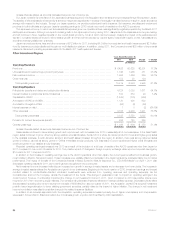
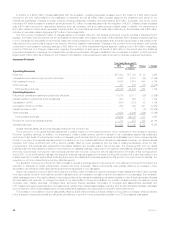
Corporate & Other
Years Ended December 31,
2011 2010 Change % Change
(In millions)
Operating Revenues
Premiums ........................................................................ $ 10 $ 11 $ (1) (9.1)%
Net investment income .............................................................. 914 643 271 42.1%
Other revenues .................................................................... 319 391 (72) (18.4)%
Total operating revenues .......................................................... 1,243 1,045 198 18.9%
Operating Expenses
Policyholder benefits and claims and policyholder dividends ................................. 8 (14) 22
Amortization of DAC and VOBA ....................................................... 1 1 — —%
Interest expense on debt ............................................................ 1,294 1,126 168 14.9%
Other expenses ................................................................... 627 467 160 34.3%
Total operating expenses .......................................................... 1,930 1,580 350 22.2%
Provision for income tax expense (benefit) ............................................... (552) (366) (186) (50.8)%
Operating earnings ................................................................. (135) (169) 34 20.1%
Less: Preferred stock dividends ....................................................... 122 122 — —%
Operating earnings available to common shareholders ..................................... $ (257) $ (291) $ 34 11.7%
Unless otherwise stated, all amounts discussed below are net of income tax.
MetLife, Inc. completed four debt financings in August 2010 in connection with the Acquisition, issuing $1.0 billion of 2.375% senior notes, $1.0
billion of 4.75% senior notes, $750 million of 5.875% senior notes, and $250 million of floating rate senior notes. MetLife, Inc. also issued debt
securities in November 2010, which are part of the $3.0 billion stated value of common equity units. The proceeds from these debt issuances were
used to finance the Acquisition.
Operating earnings available to common shareholders and operating earnings each increased $34 million, primarily due to higher net investment
income and a higher tax benefit. These increases were partially offset by an increase in interest expense of $109 million, primarily resulting from the
2010 debt issuances, a decrease in earnings related to resolutions of certain legal matters in 2010 and an increase in other expenses.
Net investment income increased $176 million due to an increase of $130 million from higher yields and an increase of $46 million from growth in
average invested assets. Yields were primarily impacted by the decline in interest rates, as lower crediting rates were paid to the segments on the
economic capital invested on their behalf period over period, lower returns in equity markets and lower returns on alternative investments. An increase in
the average invested assets was primarily due to proceeds from the debt issuances referenced above. Our investments primarily include structured
securities, investment grade corporate fixed maturities, mortgage loans and U.S. Treasury and agency securities. In addition, our investment portfolio
includes the excess capital not allocated to the segments. Accordingly, it includes a higher allocation to certain other invested asset classes to provide
additional diversification and opportunity for long-term yield enhancement, including leveraged leases, other limited partnership interests, real estate, real
estate joint ventures, trading and other securities and equity securities.
Corporate & Other also benefited in 2011 from a higher tax benefit of $133 million over 2010 primarily due to $75 million of charges in 2010 related
to the Health Care Act. The higher tax benefit was also a result of higher utilization of tax preferenced investments which provide tax credits and
deductions.
Results from our mortgage loan servicing business were lower, driven by an increase in expenses of $31 million in response to both a larger portfolio
and increased regulatory oversight. In addition hedging results were lower by $21 million.
The Company incurred $40 million of expenses related to a liquidation plan filed by the Department of Financial Services for ELNY in the third quarter
of 2011. In addition, the Company increased advertising costs by $15 million and incurred higher internal resources costs for associates committed to
the Acquisition of $13 million. Minor fluctuations in various other expense categories, such as interest on uncertain tax positions, and discretionary
spending, such as consulting and postemployment related costs, offset each other and resulted in a small increase to earnings. Additionally, the
resolutions of certain legal matters in the prior period resulted in $39 million of lower operating earnings for 2011.
MetLife, Inc. 27