MetLife 2011 Annual Report Download - page 175
Download and view the complete annual report
Please find page 175 of the 2011 MetLife annual report below. You can navigate through the pages in the report by either clicking on the pages listed below, or by using the keyword search tool below to find specific information within the annual report.-
 1
1 -
2
-
3
-
4
-
5
-
6
-
7
-
8
-
9
-
10
-
11
-
12
-
13
-
14
-
15
-
16
-
17
-
18
-
19
-
20
-
21
-
22
-
23
-
24
-
25
-
26
-
27
-
28
-
29
-
30
-
31
-
32
-
33
-
34
-
35
-
36
-
37
-
38
-
39
-
40
-
41
-
42
-
43
-
44
-
45
-
46
-
47
-
48
-
49
-
50
-
51
-
52
-
53
-
54
-
55
-
56
-
57
-
58
-
59
-
60
-
61
-
62
-
63
-
64
-
65
-
66
-
67
-
68
-
69
-
70
-
71
-
72
-
73
-
74
-
75
-
76
-
77
-
78
-
79
-
80
-
81
-
82
-
83
-
84
-
85
-
86
-
87
-
88
-
89
-
90
-
91
-
92
-
93
-
94
-
95
-
96
-
97
-
98
-
99
-
100
-
101
-
102
-
103
-
104
-
105
-
106
-
107
-
108
-
109
-
110
-
111
-
112
-
113
-
114
-
115
-
116
-
117
-
118
-
119
-
120
-
121
-
122
-
123
-
124
-
125
-
126
-
127
-
128
-
129
-
130
-
131
-
132
-
133
-
134
-
135
-
136
-
137
-
138
-
139
-
140
-
141
-
142
-
143
-
144
-
145
-
146
-
147
-
148
-
149
-
150
-
151
-
152
-
153
-
154
-
155
-
156
-
157
-
158
-
159
-
160
-
161
-
162
-
163
-
164
-
 165
165 -
 166
166 -
 167
167 -
 168
168 -
 169
169 -
 170
170 -
 171
171 -
 172
172 -
 173
173 -
 174
174 -
 175
175 -
 176
176 -
 177
177 -
 178
178 -
 179
179 -
 180
180 -
 181
181 -
 182
182 -
 183
183 -
 184
184 -
 185
185 -
186
-
187
-
188
-
189
-
190
-
191
-
192
-
193
-
194
-
195
-
196
-
197
-
198
-
199
-
200
-
201
-
202
-
203
-
204
-
205
-
206
-
207
-
208
-
209
-
210
-
211
-
212
-
213
-
214
-
215
-
216
-
217
-
218
-
219
-
220
-
221
-
222
-
223
-
224
-
225
-
226
-
227
-
228
-
229
-
230
-
231
-
232
-
233
-
234
-
235
-
236
-
237
-
238
-
239
-
240
-
241
-
242
-
243
 |
 |

MetLife, Inc.
Notes to the Consolidated Financial Statements — (Continued)
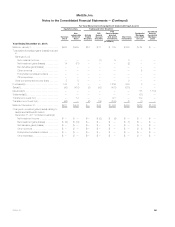
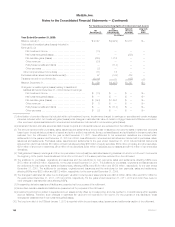
(3) Real estate joint ventures — The impaired investments presented above were accounted for using the cost method. Impairments on these cost
method investments were recognized at estimated fair value determined from information provided in the financial statements of the underlying
entities in the period in which the impairment was incurred. These impairments to estimated fair value represent non-recurring fair value
measurements that have been classified as Level 3 due to the limited activity and price transparency inherent in the market for such investments.
This category includes several real estate funds that typically invest primarily in commercial real estate. The estimated fair values of these investments
have been determined using the NAV of the Company’s ownership interest in the partners’ capital. Distributions from these investments will be
generated from investment gains, from operating income from the underlying investments of the funds and from liquidation of the underlying assets
of the funds. It is estimated that the underlying assets of the funds will be liquidated over the next two to 10 years. There were no unfunded
commitments for these investments at December 31, 2011. Unfunded commitments for these investments were $6 million at December 31, 2010.
(4) Goodwill — As discussed in Notes 2 and 7, the Company recorded an impairment of goodwill associated with MetLife Bank. This impairment has
been categorized as Level 3 due to the significant unobservable inputs used in the determination of the associated estimated fair value.
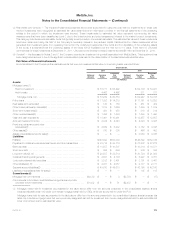
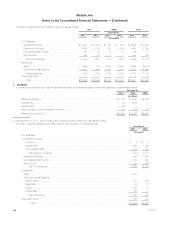
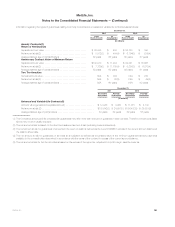
Fair Value of Financial Instruments
Amounts related to the Company’s financial instruments that were not measured at fair value on a recurring basis, were as follows:
December 31,
2011 2010
Notional
Amount Carrying
Value
Estimated
Fair
Value Notional
Amount Carrying
Value
Estimated
Fair
Value
(In millions)
Assets:
Mortgage loans:(1)
Held-for-investment ......................................... $ 53,777 $ 56,422 $ 52,136 $ 53,927
Held-for-sale .............................................. 4,462 4,462 811 811
Mortgage loans, net ....................................... $ 58,239 $ 60,884 $ 52,947 $ 54,738
Policy loans ................................................. $ 11,892 $ 14,213 $ 11,761 $ 13,253
Real estate joint ventures(2) ..................................... $ 130 $ 183 $ 451 $ 482
Other limited partnership interests(2) .............................. $ 1,318 $ 1,656 $ 1,539 $ 1,619
Short-term investments(3) ...................................... $ 450 $ 450 $ 819 $ 819
Other invested assets(2) ....................................... $ 1,434 $ 1,434 $ 1,490 $ 1,490
Cash and cash equivalents ..................................... $ 10,461 $ 10,461 $ 12,957 $ 12,957
Accrued investment income .................................... $ 4,344 $ 4,344 $ 4,328 $ 4,328
Premiums, reinsurance and other
receivables(2) .............................................. $ 4,639 $ 5,232 $ 3,752 $ 4,048
Other assets(2) .............................................. $ 310 $ 308 $ 466 $ 453
Assets of subsidiaries held-for-sale(2) ............................. $ — $ — $ 3,068 $ 3,068
Liabilities:
PABs(2) .................................................... $146,890 $153,304 $146,822 $152,745
Payables for collateral under securities loaned and other transactions .... $ 33,716 $ 33,716 $ 27,272 $ 27,272
Bank deposits ............................................... $ 10,507 $ 10,507 $ 10,316 $ 10,371
Short-term debt .............................................. $ 686 $ 686 $ 306 $ 306
Long-term debt(2), (4) ......................................... $ 20,587 $ 22,514 $ 20,734 $ 21,892
Collateral financing arrangements ................................ $ 4,647 $ 4,136 $ 5,297 $ 4,757
Junior subordinated debt securities ............................... $ 3,192 $ 3,491 $ 3,191 $ 3,461
Other liabilities(2), (5) .......................................... $ 4,087 $ 4,087 $ 2,777 $ 2,777
Separate account liabilities(2) .................................... $ 49,610 $ 49,610 $ 42,160 $ 42,160
Liabilities of subsidiaries held-for-sale(2) ........................... $ — $ — $ 105 $ 105
Commitments:(6)
Mortgage loan commitments .................................... $4,129 $ — $ 3 $3,754 $ — $ (17)
Commitments to fund bank credit facilities, bridge loans and private
corporate bond investments .................................. $1,432 $ — $ 51 $2,437 $ — $ —
(1) Mortgage loans held-for-investment as presented in the table above differ from the amounts presented in the consolidated balance sheets
because this table does not include commercial mortgage loans held by CSEs, which are accounted for under the FVO.
Mortgage loans held-for-sale as presented in the table above differ from the amounts presented in the consolidated balance sheets because this
table only includes mortgage loans that were previously designated as held-for-investment but now are designated as held-for-sale and stated at
lower of amortized cost or estimated fair value.
MetLife, Inc. 171