MetLife 2011 Annual Report Download - page 61
Download and view the complete annual report
Please find page 61 of the 2011 MetLife annual report below. You can navigate through the pages in the report by either clicking on the pages listed below, or by using the keyword search tool below to find specific information within the annual report.-
 1
1 -
2
-
3
-
4
-
5
-
6
-
7
-
8
-
9
-
10
-
11
-
12
-
13
-
14
-
15
-
16
-
17
-
18
-
19
-
20
-
21
-
22
-
23
-
24
-
25
-
26
-
27
-
28
-
29
-
30
-
31
-
32
-
33
-
34
-
35
-
36
-
37
-
38
-
39
-
40
-
41
-
42
-
43
-
44
-
45
-
46
-
47
-
48
-
49
-
50
-
 51
51 -
 52
52 -
 53
53 -
 54
54 -
 55
55 -
 56
56 -
 57
57 -
 58
58 -
 59
59 -
 60
60 -
 61
61 -
 62
62 -
 63
63 -
 64
64 -
 65
65 -
 66
66 -
 67
67 -
 68
68 -
 69
69 -
 70
70 -
 71
71 -
72
-
73
-
74
-
75
-
76
-
77
-
78
-
79
-
80
-
81
-
82
-
83
-
84
-
85
-
86
-
87
-
88
-
89
-
90
-
91
-
92
-
93
-
94
-
95
-
96
-
97
-
98
-
99
-
100
-
101
-
102
-
103
-
104
-
105
-
106
-
107
-
108
-
109
-
110
-
111
-
112
-
113
-
114
-
115
-
116
-
117
-
118
-
119
-
120
-
121
-
122
-
123
-
124
-
125
-
126
-
127
-
128
-
129
-
130
-
131
-
132
-
133
-
134
-
135
-
136
-
137
-
138
-
139
-
140
-
141
-
142
-
143
-
144
-
145
-
146
-
147
-
148
-
149
-
150
-
151
-
152
-
153
-
154
-
155
-
156
-
157
-
158
-
159
-
160
-
161
-
162
-
163
-
164
-
165
-
166
-
167
-
168
-
169
-
170
-
171
-
172
-
173
-
174
-
175
-
176
-
177
-
178
-
179
-
180
-
181
-
182
-
183
-
184
-
185
-
186
-
187
-
188
-
189
-
190
-
191
-
192
-
193
-
194
-
195
-
196
-
197
-
198
-
199
-
200
-
201
-
202
-
203
-
204
-
205
-
206
-
207
-
208
-
209
-
210
-
211
-
212
-
213
-
214
-
215
-
216
-
217
-
218
-
219
-
220
-
221
-
222
-
223
-
224
-
225
-
226
-
227
-
228
-
229
-
230
-
231
-
232
-
233
-
234
-
235
-
236
-
237
-
238
-
239
-
240
-
241
-
242
-
243
 |
 |

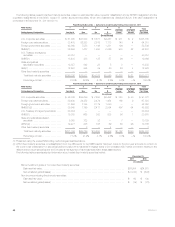
There were no impairments recognized on real estate and real estate joint ventures held-for-investment for the year ended December 31, 2011.
Impairments recognized on real estate and real estate joint ventures held-for-investment were $48 million and $160 million for the years ended
December 31, 2010 and 2009, respectively, which included impairments on cost basis real estate joint ventures of $25 million and $82 million,
respectively. There were no impaired cost basis real estate joint ventures held as of December 31, 2011. The estimated fair value of the impaired cost
basis real estate joint ventures, after impairments, held as of December 31, 2010, was $8 million. These impairments to estimated fair value represent
non-recurring fair value measurements that have been classified as Level 3 due to the limited activity and limited price transparency inherent in the
market for such investments. Impairments recognized on real estate held-for-sale were $2 million and $1 million for the years ended December 31,
2011 and 2010, respectively. There were no impairments recognized on real estate held-for-sale for the year ended December 31, 2009.
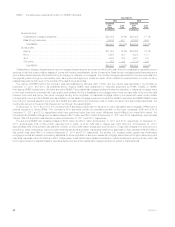
Other Limited Partnership Interests
The carrying value of other limited partnership interests (which primarily represent ownership interests in pooled investment funds that principally
make private equity investments in companies in the United States and overseas) was $6.4 billion at both December 31, 2011 and 2010, which
included $1.1 billion and $1.0 billion of hedge funds, at December 31, 2011 and 2010, respectively. Impairments to estimated fair value for such other
limited partnership interests of $5 million, $12 million and $354 million for the years ended December 31, 2011, 2010 and 2009, respectively, were
recognized within net investment gains (losses). The estimated fair value of the impaired other limited partnership interests after these impairments was
$13 million, $23 million and $561 million at December 31, 2011, 2010 and 2009, respectively. These impairments to estimated fair value represent
non-recurring fair value measurements that have been classified as Level 3 due to the limited activity and limited price transparency inherent in the
market for such investments.
Other Invested Assets
See Note 3 of the Notes to the Consolidated Financial Statements for a table that presents the Company’s other invested assets by type at
December 31, 2011 and 2010 and related information.
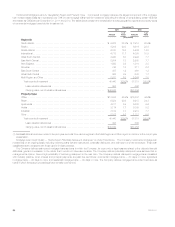
Short-term Investments and Cash Equivalents
The carrying value of short-term investments, which includes securities and other investments with remaining maturities of one year or less, but
greater than three months, at the time of purchase was $17.3 billion and $9.4 billion, or 3.3% and 2.0% of total cash and invested assets, at
December 31, 2011 and 2010, respectively. The carrying value of cash equivalents, which includes securities and other investments with an original or
remaining maturity of three months or less at the time of purchase, was $5.0 billion and $9.6 billion, or 1.0% and 2.0% of total cash and invested
assets, at December 31, 2011 and 2010, respectively.
Derivative Financial Instruments
Derivatives. The Company is exposed to various risks relating to its ongoing business operations, including interest rate risk, foreign currency risk,
credit risk, and equity market risk. The Company uses a variety of strategies to manage these risks, including the use of derivative instruments. See
Note 4 of the Notes to Consolidated Financial Statements for:
‰A comprehensive description of the nature of the Company’s derivative instruments, including the strategies for which derivatives are used in
managing various risks.
‰Information about the notional amount, estimated fair value, and primary underlying risk exposure of the Company’s derivative financial instruments,
excluding embedded derivatives held at December 31, 2011 and 2010.
Hedging. See Note 4 of the Notes to Consolidated Financial Statements for information about:
‰The notional amount and estimated fair value of derivatives and non-derivative instruments designated as hedging instruments by type of hedge
designation at December 31, 2011 and 2010.
‰The notional amount and estimated fair value of derivatives that are not designated or do not qualify as hedging instruments by derivative type at
December 31, 2011 and 2010.
‰The statement of operations effects of derivatives in cash flow, fair value, or non-qualifying hedge relationships for the years ended December 31,
2011, 2010, and 2009.
See “Quantitative and Qualitative Disclosures About Market Risk — Management of Market Risk Exposures — Hedging Activities” for more
information about the Company’s use of derivatives by major hedge program.
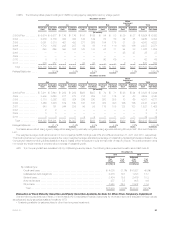
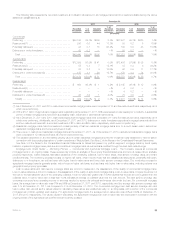
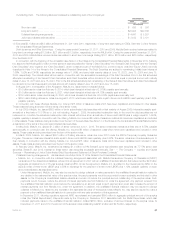
Fair Value Hierarchy. Derivatives measured at estimated fair value on a recurring basis and their corresponding fair value hierarchy, are presented
as follows:
December 31, 2011
Derivative
Assets Derivative
Liabilities
(In millions)
Quoted prices in active markets for identical assets and liabilities (Level 1) ............... $ 62 1% $ 103 3%
Significant other observable inputs (Level 2) ...................................... 14,746 90 3,750 93
Significant unobservable inputs (Level 3) ......................................... 1,392 9 158 4
Total estimated fair value ................................................... $16,200 100% $4,011 100%
The valuation of Level 3 derivatives involves the use of significant unobservable inputs and generally requires a higher degree of management
judgment or estimation than the valuations of Level 1 and Level 2 derivatives. Although Level 3 inputs are unobservable, management believes they are
consistent with what other market participants would use when pricing such instruments and are considered appropriate given the circumstances. The
use of different inputs or methodologies could have a material effect on the estimated fair value of Level 3 derivatives and could materially affect net
income.
Derivatives categorized as Level 3 at December 31, 2011 include: interest rate swaps and interest rate forwards with maturities which extend
beyond the observable portion of the yield curve; interest rate lock commitments with certain unobservable inputs, including pull-through rates; equity
variance swaps with unobservable volatility inputs; foreign currency swaps which are cancelable and priced through independent broker quotations;
credit default swaps based upon baskets of credits having unobservable credit spreads, or that are priced through independent broker quotations;
MetLife, Inc. 57