MetLife 2011 Annual Report Download - page 86
Download and view the complete annual report
Please find page 86 of the 2011 MetLife annual report below. You can navigate through the pages in the report by either clicking on the pages listed below, or by using the keyword search tool below to find specific information within the annual report.-
 1
1 -
2
-
3
-
4
-
5
-
6
-
7
-
8
-
9
-
10
-
11
-
12
-
13
-
14
-
15
-
16
-
17
-
18
-
19
-
20
-
21
-
22
-
23
-
24
-
25
-
26
-
27
-
28
-
29
-
30
-
31
-
32
-
33
-
34
-
35
-
36
-
37
-
38
-
39
-
40
-
41
-
42
-
43
-
44
-
45
-
46
-
47
-
48
-
49
-
50
-
51
-
52
-
53
-
54
-
55
-
56
-
57
-
58
-
59
-
60
-
61
-
62
-
63
-
64
-
65
-
66
-
67
-
68
-
69
-
70
-
71
-
72
-
73
-
74
-
75
-
 76
76 -
 77
77 -
 78
78 -
 79
79 -
 80
80 -
 81
81 -
 82
82 -
 83
83 -
 84
84 -
 85
85 -
 86
86 -
 87
87 -
 88
88 -
 89
89 -
 90
90 -
 91
91 -
 92
92 -
 93
93 -
 94
94 -
 95
95 -
 96
96 -
97
-
98
-
99
-
100
-
101
-
102
-
103
-
104
-
105
-
106
-
107
-
108
-
109
-
110
-
111
-
112
-
113
-
114
-
115
-
116
-
117
-
118
-
119
-
120
-
121
-
122
-
123
-
124
-
125
-
126
-
127
-
128
-
129
-
130
-
131
-
132
-
133
-
134
-
135
-
136
-
137
-
138
-
139
-
140
-
141
-
142
-
143
-
144
-
145
-
146
-
147
-
148
-
149
-
150
-
151
-
152
-
153
-
154
-
155
-
156
-
157
-
158
-
159
-
160
-
161
-
162
-
163
-
164
-
165
-
166
-
167
-
168
-
169
-
170
-
171
-
172
-
173
-
174
-
175
-
176
-
177
-
178
-
179
-
180
-
181
-
182
-
183
-
184
-
185
-
186
-
187
-
188
-
189
-
190
-
191
-
192
-
193
-
194
-
195
-
196
-
197
-
198
-
199
-
200
-
201
-
202
-
203
-
204
-
205
-
206
-
207
-
208
-
209
-
210
-
211
-
212
-
213
-
214
-
215
-
216
-
217
-
218
-
219
-
220
-
221
-
222
-
223
-
224
-
225
-
226
-
227
-
228
-
229
-
230
-
231
-
232
-
233
-
234
-
235
-
236
-
237
-
238
-
239
-
240
-
241
-
242
-
243
 |
 |

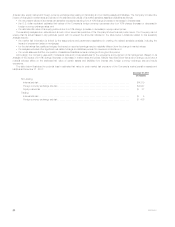
Interest rate risk has decreased by $1.1 billion, or 20%, to $4.3 billion at December 31, 2011 from $5.4 billion at December 31, 2010. The
decrease in risk is primarily due to a large decline in interest rates across the long end of the swaps and U.S. Treasury curves which decreased risk by
$1.8 billion. This decrease in risk was partially offset by a change in the net asset and liability bases of $590 million and the yield impact to long term
debt of $230 million. The remainder of the fluctuation is attributable to numerous immaterial items.
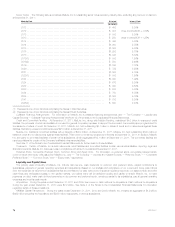
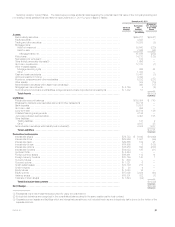
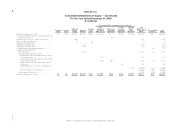
Sensitivity Analysis: Foreign Currency Exchange Rates. The table below provides additional detail regarding the potential loss in estimated fair value
of the Company’s portfolio due to a 10% change in foreign currency exchange rates at December 31, 2011 by type of asset or liability:
December 31, 2011
Notional
Amount
Estimated
Fair
Value(1)
Assuming a
10% Increase
in the Foreign
Exchange Rate
(In millions)
Assets:
Fixed maturity securities ................................................................... $350,271 $(7,945)
Equity securities ......................................................................... 3,023 (106)
Trading and other securities ............................................................... 18,268 (486)
Mortgage loans:
Held-for-investment .................................................................... 59,560 (450)
Held-for-sale ......................................................................... 7,526 —
Mortgage loans, net .................................................................. 67,086 (450)
Policy loans ............................................................................ 14,213 (187)
Other limited partnership interests ........................................................... 1,656 (10)
Short-term investments ................................................................... 17,310 (204)
Other invested assets: ....................................................................
Mortgage servicing rights ................................................................ 666 —
Other ............................................................................... 1,434 (62)
Cash and cash equivalents ................................................................ 10,461 (135)
Accrued investment income ............................................................... 4,344 (7)
Premiums, reinsurance and other receivables .................................................. 5,232 (162)
Other assets ........................................................................... 308 (7)
Total Assets ........................................................................ $(9,761)
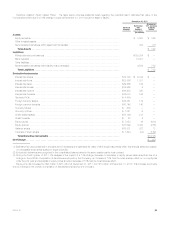
Liabilities:
Policyholder account balances ............................................................. $153,304 $ 3,375
Bank deposits .......................................................................... 10,507 —
Long-term debt ......................................................................... 22,514 126
Payable for collateral under securities loaned and other transactions ................................ 33,716 3
Other liabilities .......................................................................... 4,087 163
Net embedded derivatives within liability host contracts(2) ........................................ 4,584 476
Total Liabilities ...................................................................... $ 4,143
Derivative Instruments:
Interest rate swaps ...................................................................... $79,733 $ 6,042 $ (41)
Interest rate floors ....................................................................... $23,866 1,081 —
Interest rate caps ........................................................................ $49,665 102 —
Interest rate futures ...................................................................... $14,965 6 (3)
Interest rate options ...................................................................... $16,988 890 (17)
Interest rate forwards ..................................................................... $14,033 195 —
Synthetic GICs .......................................................................... $ 4,454 — —
Foreign currency swaps .................................................................. $16,461 112 736
Foreign currency forwards ................................................................. $10,149 140 46
Currency futures ........................................................................ $ 633 — (53)
Currency options ........................................................................ $ 1,321 6 29
Credit default swaps ..................................................................... $13,136 213 —
Credit forwards ......................................................................... $ 20 4 —
Equity futures ........................................................................... $ 7,053 16 (3)
Equity options .......................................................................... $17,099 3,084 (109)
Variance swaps ......................................................................... $18,801 322 —
Total rate of return swaps ................................................................. $ 1,644 (24) —
Total Derivative Instruments .......................................................... $ 585
Net Change ............................................................................. $(5,033)
(1) Estimated fair value presented in the table above represents the estimated fair value of all financial instruments within this financial statement caption
not necessarily those solely subject to foreign exchange risk.
(2) Embedded derivatives are recognized in the consolidated balance sheet in the same caption as the host contract.
Foreign currency exchange rate risk increased by $1.0 billion, to $5.0 billion at December 31, 2011 from $4.0 billion at December 31, 2010. This
change was due to an increase in exchange rate risk relating to fixed maturity securities (including trading and other securities) of $1.6 billion due to
higher net exposures primarily to the British pound, the Australian dollar and the Japanese yen. This was partially offset by an increase in the foreign
exposure related to PABs and other liabilities and the use of derivatives employed by the Company of $274 million and $280 million, respectively. The
remainder of the fluctuation is attributable to numerous immaterial items.
82 MetLife, Inc.