MetLife 2011 Annual Report Download - page 138
Download and view the complete annual report
Please find page 138 of the 2011 MetLife annual report below. You can navigate through the pages in the report by either clicking on the pages listed below, or by using the keyword search tool below to find specific information within the annual report.-
 1
1 -
2
-
3
-
4
-
5
-
6
-
7
-
8
-
9
-
10
-
11
-
12
-
13
-
14
-
15
-
16
-
17
-
18
-
19
-
20
-
21
-
22
-
23
-
24
-
25
-
26
-
27
-
28
-
29
-
30
-
31
-
32
-
33
-
34
-
35
-
36
-
37
-
38
-
39
-
40
-
41
-
42
-
43
-
44
-
45
-
46
-
47
-
48
-
49
-
50
-
51
-
52
-
53
-
54
-
55
-
56
-
57
-
58
-
59
-
60
-
61
-
62
-
63
-
64
-
65
-
66
-
67
-
68
-
69
-
70
-
71
-
72
-
73
-
74
-
75
-
76
-
77
-
78
-
79
-
80
-
81
-
82
-
83
-
84
-
85
-
86
-
87
-
88
-
89
-
90
-
91
-
92
-
93
-
94
-
95
-
96
-
97
-
98
-
99
-
100
-
101
-
102
-
103
-
104
-
105
-
106
-
107
-
108
-
109
-
110
-
111
-
112
-
113
-
114
-
115
-
116
-
117
-
118
-
119
-
120
-
121
-
122
-
123
-
124
-
125
-
126
-
127
-
 128
128 -
 129
129 -
 130
130 -
 131
131 -
 132
132 -
 133
133 -
 134
134 -
 135
135 -
 136
136 -
 137
137 -
 138
138 -
 139
139 -
 140
140 -
 141
141 -
 142
142 -
 143
143 -
 144
144 -
 145
145 -
 146
146 -
 147
147 -
 148
148 -
149
-
150
-
151
-
152
-
153
-
154
-
155
-
156
-
157
-
158
-
159
-
160
-
161
-
162
-
163
-
164
-
165
-
166
-
167
-
168
-
169
-
170
-
171
-
172
-
173
-
174
-
175
-
176
-
177
-
178
-
179
-
180
-
181
-
182
-
183
-
184
-
185
-
186
-
187
-
188
-
189
-
190
-
191
-
192
-
193
-
194
-
195
-
196
-
197
-
198
-
199
-
200
-
201
-
202
-
203
-
204
-
205
-
206
-
207
-
208
-
209
-
210
-
211
-
212
-
213
-
214
-
215
-
216
-
217
-
218
-
219
-
220
-
221
-
222
-
223
-
224
-
225
-
226
-
227
-
228
-
229
-
230
-
231
-
232
-
233
-
234
-
235
-
236
-
237
-
238
-
239
-
240
-
241
-
242
-
243
 |
 |

MetLife, Inc.
Notes to the Consolidated Financial Statements — (Continued)
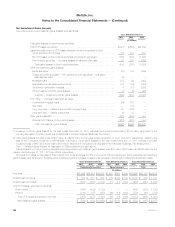
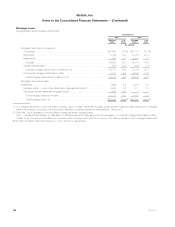
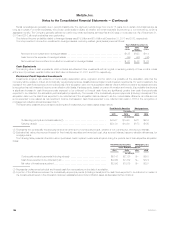
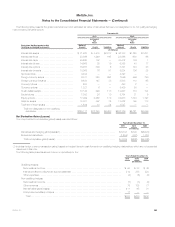
Mortgage Loans Modified in a Troubled Debt Restructuring. See Note 1 for a discussion of loan modifications that are classified as trouble debt
restructuring and the types of concession typically granted. At December 31, 2011, the number of mortgage loans and carrying value after specific
valuation allowance of mortgage loans modified during the period in a troubled debt restructuring were as follows:
Mortgage Loans Modified in a Troubled Debt
Restructuring
December 31, 2011
Number of
Mortgage
Loans Carrying Value after Specific
Valuation Allowance
Pre-
Modification Post-
Modification
(In millions)
Commercial ............................................................. 5 $147 $111
Agricultural .............................................................. 10 42 42
Residential .............................................................. — — —
Total ................................................................. 15 $189 $153
During the previous 12 months, the Company had four agricultural mortgage loans, with a carrying value after specific valuation allowance of
$13 million, modified in a troubled debt restructuring with a subsequent payment default at December 31, 2011. There were no commercial or
residential mortgage loans during the previous 12 months modified in a troubled debt restructuring with a subsequent payment default at December 31,
2011. Payment default is determined in the same manner as delinquency status — when interest and principal payments are past due as follows:
commercial mortgage loans — 60 days or more; agricultural mortgage loans — 90 days or more; and residential mortgage loans — 60 days or more.
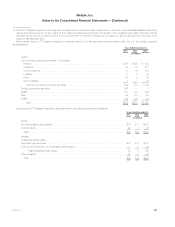
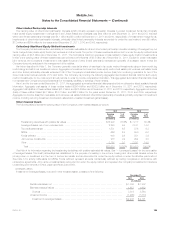
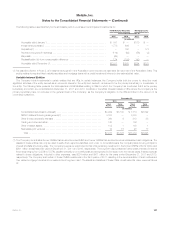
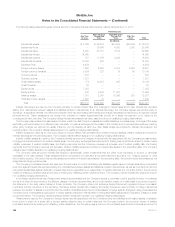
Real Estate and Real Estate Joint Ventures
Real estate investments by type consisted of the following:
December 31,
2011 2010
Carrying
Value %of
Total Carrying
Value %of
Total
(In millions) (In millions)
Traditional .......................................................... $5,958 69.6% $4,987 62.1%
Real estate joint ventures and funds ...................................... 2,340 27.3 2,707 33.7
Real estate and real estate joint ventures ................................. 8,298 96.9 7,694 95.8
Foreclosed (commercial, agricultural and residential) .......................... 264 3.1 152 1.9
Real estate held-for-investment ........................................ 8,562 100.0 7,846 97.7
Real estate held-for-sale ............................................... 1 — 184 2.3
Total real estate and real estate joint ventures ............................. $8,563 100.0% $8,030 100.0%
The Company classifies within traditional real estate its investment in income-producing real estate, which is comprised primarily of wholly-owned
real estate and, to a much lesser extent, joint ventures with interests in single property income-producing real estate. The estimated fair value of the
traditional real estate investment portfolio was $7.7 billion and $6.3 billion at December 31, 2011 and 2010, respectively. The Company classifies within
real estate joint ventures and funds, its investments in joint ventures with interests in multi-property projects with varying strategies ranging from the
development of properties to the operation of income-producing properties; as well as its investments in real estate private equity funds. From time to
time, the Company transfers investments from these joint ventures to traditional real estate, if the Company retains an interest in the joint venture after a
completed property commences operations and the Company intends to retain an interest in the property.
Properties acquired through foreclosure were $295 million, $165 million and $127 million for the years ended December 31, 2011, 2010 and 2009,
respectively, and include commercial, agricultural and residential properties. After the Company acquires properties through foreclosure, it evaluates
whether the properties are appropriate for retention in its traditional real estate portfolio. Foreclosed real estate held at December 31, 2011 and 2010
includes those properties the Company has not selected for retention in its traditional real estate portfolio and which do not meet the criteria to be
classified as held-for-sale.
The wholly-owned real estate within traditional real estate is net of accumulated depreciation of $1.3 billion and $1.5 billion at December 31, 2011
and 2010, respectively. Related depreciation expense on traditional wholly-owned real estate was $164 million, $151 million and $135 million for the
years ended December 31, 2011, 2010 and 2009, respectively. These amounts include depreciation expense related to discontinued operations of
$7 million, $16 million and $17 million for the years ended December 31, 2011, 2010 and 2009, respectively.
There were no impairments recognized on real estate held-for-investment for the year ended December 31, 2011. Impairments recognized on real
estate held-for-investment were $48 million and $160 million for the years ended December 31, 2010 and 2009, respectively. Impairments recognized
on real estate held-for-sale were $2 million and $1 million for the years ended December 31, 2011 and 2010, respectively. There were no impairments
recognized on real estate held-for-sale for the year ended December 31, 2009. The Company’s carrying value of real estate held-for-sale has been
reduced by impairments recorded prior to 2009 of $1 million at both December 31, 2011 and 2010. The carrying value of non-income producing real
estate was $182 million and $137 million at December 31, 2011 and 2010, respectively.
134 MetLife, Inc.